Hive Gann (Fractals) & little Bitcoin Chart Update
(deutsch am Ende)
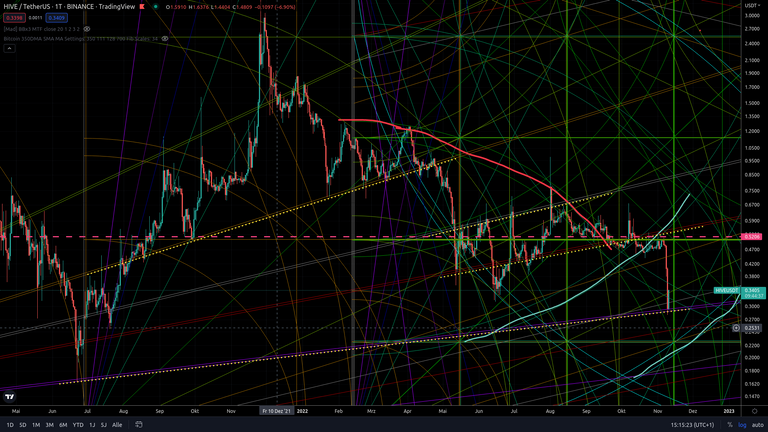
The hive course was clearly rejected at the quadrant boundary (red dashed line) of the smallest and larger fractals (both overlapping there with their quadrant boundary)-.
Hive tried for some time to get through this into the next quadrant but on the last attempt there was a clear rejection and the course dropped very sharply.
Thus from the overlapping fan also rejected and rushed to the next (purple), which so far held well (yellow dotted; from fan orange to red, longer between red and gray, under red - not managed to get across - purple caught)
Now it will be exciting if we stay longer at (best above) the purple fan, directly from it again upwards to test the green arc from the smaller fractal or even again downwards the blue arc of the larger fractal.
One could forecast a mixture of the last fall of June 2022 and the one of June 2021.
So a quick retest to the top. How it will develop exactly, of course, can not be predicted.
No one can.
Gann's fractals serve as an orientation aid and map in an otherwise very empty and disoriented coordinate system.
I have set the first and largest fractal in this chart 2-3 years ago, probably even earlier if you include the Steem chart!
So no. I do not adjust the strokes, fans, arcs on it every day depending on the price movement.
I haven't done anything at the chart already since February 2022 - back then I had only put in the smaller fractal - except: the markings (dashed, painted) to draw attention to certain points, moments, fans, arcs I have updated just now.
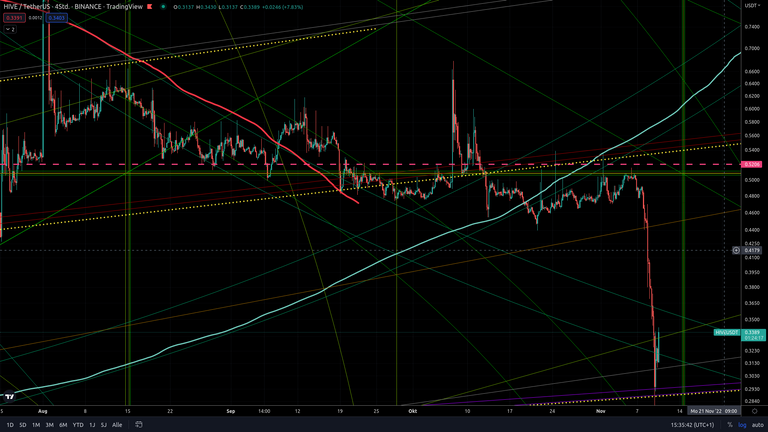
Here's another 4h chart screenshot to see some details - it's very accurate and up to date for the fact that I set the fractals ages ago (YEARS!), and just inserted finer, smaller ones into the first one.
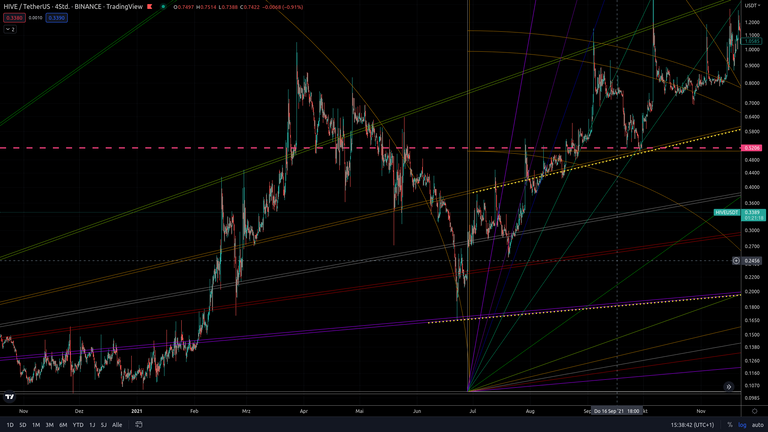
And here also June 2021 for comparison:
Where he came down to the same purple fan!
Here also the comparison to my last post (about fractals, Gann, the Hive Chart)
in which we had unfortunately lost the quadrant boundary and the ascending fan (both marked in white).
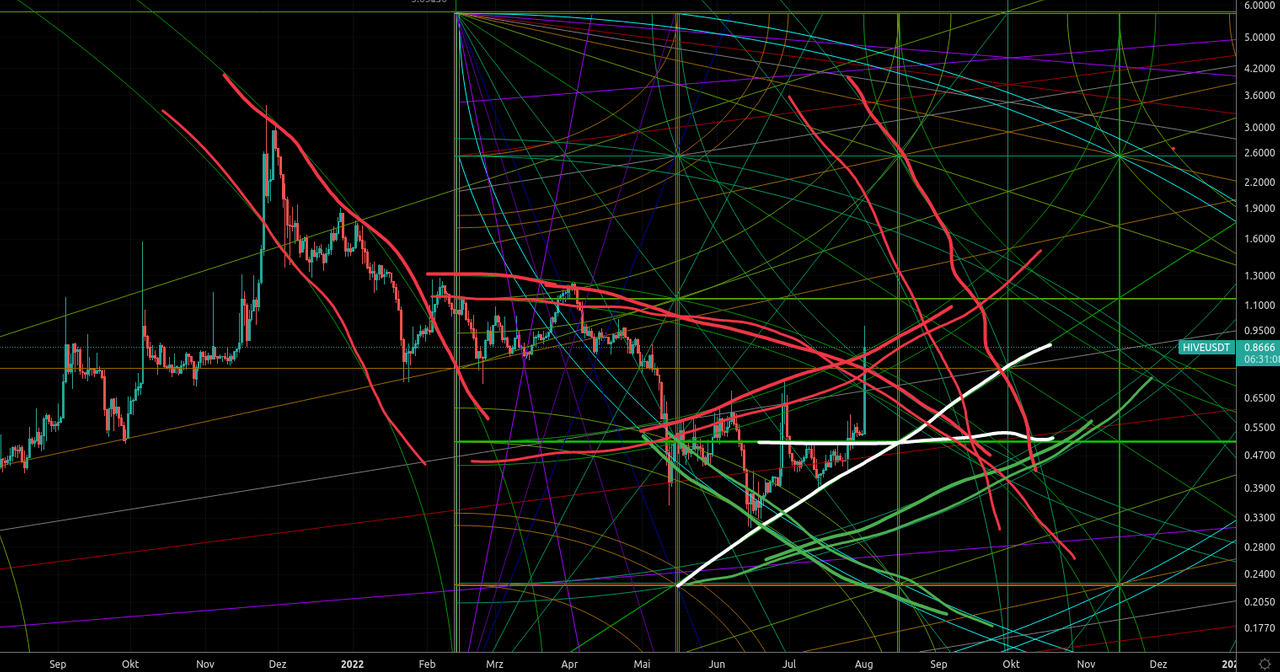
The old (white and now red dashed) quadrant boundary, which I already marked in my August 1 post, has now rejected the hive course very directly for now.
Also, the green arc from the last post (now highlighted in turquoise) did not hold - Hive worked its way sideways and was rejected from below.
https://peakd.com/hive-167922/@woelfchen/hive-pump-charts

And for the end a little comparison between my Bitcoin Charts
August 1 2022:
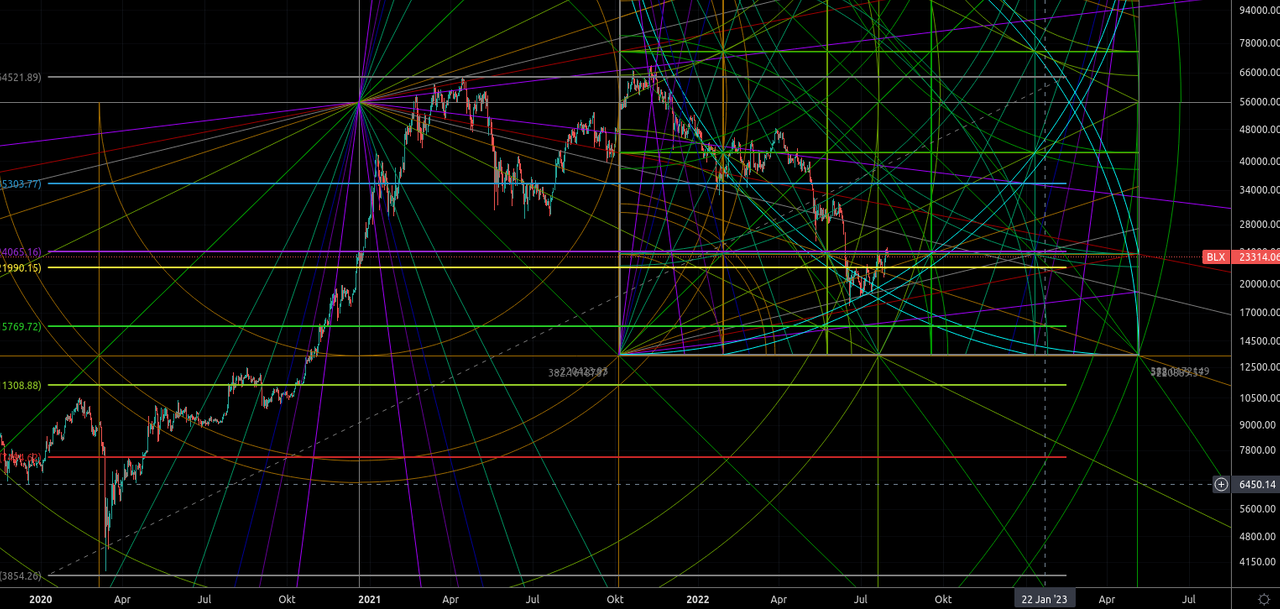
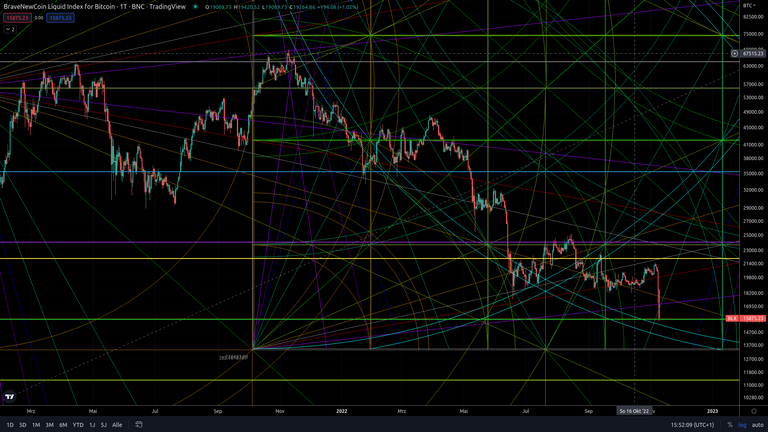
November 10 2022:
I strongly expect that we will still see the turquoise arc, not just currently the fibonacci retracement (green):

Der Hive Kurs wurde ganz klar an der Quadrantenbegrenzung (rot gestrichelte Linie) des kleinsten und größeren Fraktals (beide überlappen dort mit ihrer Quadrantenbegrenzung) abgelehnt-
Hive versuchte einige Zeit durch diese in den nächsten Quadranten zu kommen doch bei dem letzten Versuch gab es eine klare Abweisung und der Kurs ist sehr stark eingebrochen.
Somit von dem überliegenden Fächer ebenfalls abgelehnt und auf den nächsten gestürzt (lila), welche soweit gut gehalten hat (gelb gepunktelt; von Fächer orange zu rot, länger zwischen rot und grau, unter rot - nicht mehr geschafft rüber zu kommen - lila hat aufgefangen)
Nun wird es spannend ob wir uns länger an (am besten über) dem lila Fächer bleiben, direkt von diesem wieder nach oben den grünen Bogen aus dem kleineren Fraktal testen oder sogar nochmal nach unten den blauen Bogen des größeren Fraktals.
Man könnte eine Mischung aus dem letzten Sturz von Juni 2022 und dem von Juni 2021 prognostizieren.
Also ein schneller Retest nach oben. Wie es sich genau entwickeln wird kann man natürlich nicht vorhersagen.
Dies kann niemand.
Die Fraktale von Gann dienen als Orientierungshilfe und Landkarte in einem ansonsten sehr leeren und orientierungslosen Koordinatensystem.
Ich habe das erste und größte Fraktal in diesem Chart vor 2-3 Jahren, wahrscheinlich sogar noch früher wenn man den Steem Chart miteinbezieht, gesetzt!
Also nein. Ich passe die Striche, Fächer, Bögen nicht jeden Tag je nach Kursbewegung darauf an.
Ich habe an dem Chart bereits seit Februar 2022 gar nichts mehr gemacht - da hatte ich das lediglich das kleinere Fraktal reingesetzt - ausgenommen: die Markierungen (gestrichelt, gemalt) um auf bestimmte aufmerksam zu machen welche ich gerade eben auf den aktuellen Zeitpunkt angepasst habe.
Hier noch ein 4h Chart Screenshot um ein paar Details zu sehen - es ist dafür dass ich die Fraktale vor Ewigkeiten (JAHREN!) gesetzt, und lediglich feinere, kleinere in das Erste eingesetzt, habe, sehr präzise und aktuell.

Und hier auch noch Juni 2021 zum Vergleich:
Da kam er auf den gleichen lila Fächer!

Hier auch noch der Vergleich zu meinem letzten Post (über Fraktale, Gann, den Hive Chart)
in dem wir leider die Quadrantenbegrenzung und den aufsteigenden Fächer (beide weiß markiert) verloren hatten.

https://peakd.com/hive-167922/@woelfchen/hive-pump-charts
Die alte (weiße und nun rot gestrichelte) Quadrantenbegrenzung, welche ich bereits in meinem Post vom 1. August markierte hat den Hive Kurs nun erstmal sehr direkt abgelehnt.
Auch der grüne Bogen aus dem letzten Post (nun türkis markiert) hat nicht gehalten - Hive hat sich seitwärts durchgearbeitet und wurde von unten abgelehnt.

Und zum Schluss noch ein kleiner Vergleich zwischen meinen Bitcoin Charts
August 1 2022:

November 10 2022:
Ich gehe sehr stark davon aus, dass wir noch den türkisen Bogen, nicht nur aktuell das fibonacci retracement (grün) sehen werden:

!PIZZA !invest_vote
I gifted $PIZZA slices here:
@mundharmonika(1/5) tipped @woelfchen (x1)
Join us in Discord!
Hopefully this is the bottom, we will start to seen a bull run soon, i wish in the next year 2023
I'm not sure about it being the bottom..
But it is really hard to estimate - as always
but I have contact with some mates who are very deep into game theory and some of them even claim 5.8k will be the bottom
dollar cost average is the way