Crypto Analysis | Bitcoin's Waterfall Movement
Good day Hiveians!
Join me in analyzing the crypto markets!
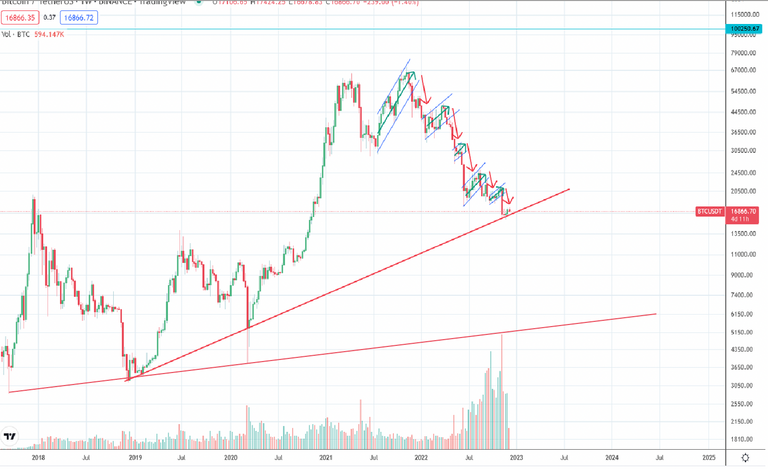
Since its peak, Bitcoin has followed a waterfall movement
It's quite obvious so I'll just post the chart:
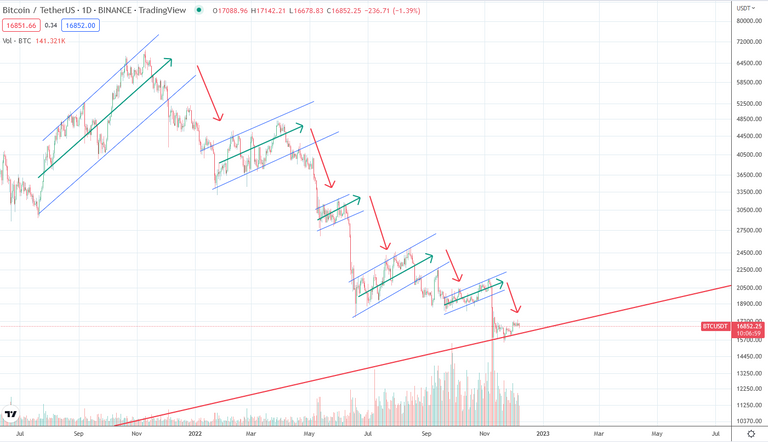
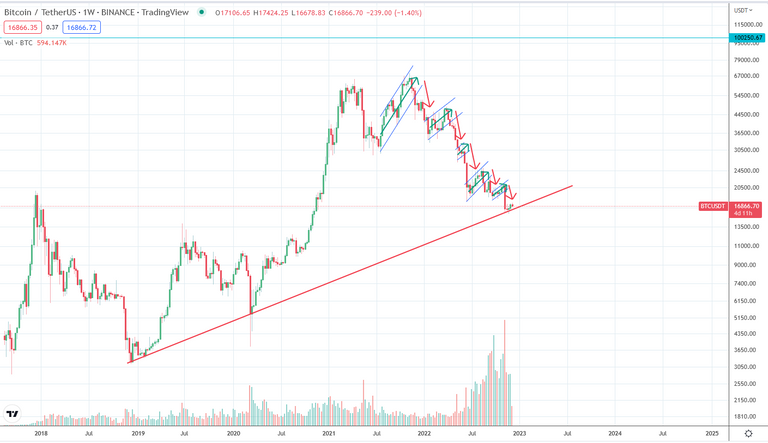
On hindsight, it appears now obvious that price would fall all the way back to 15-16k since there is a strong support on the weekly chart there. If you have been following my TA on Bitcoin you are probably aware of this supporting trend line:
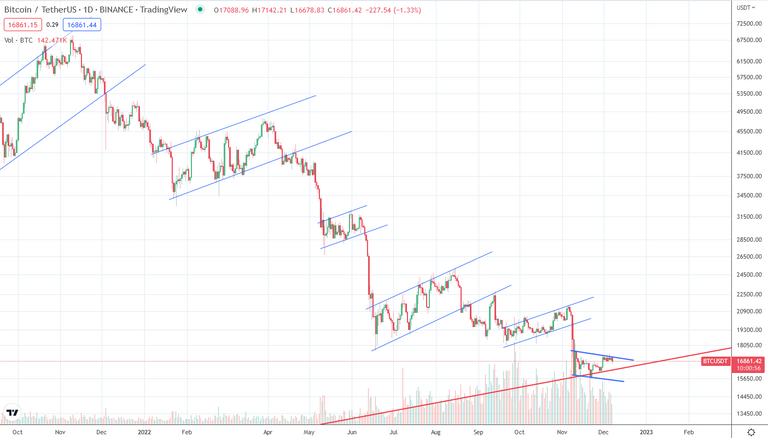
Will it hold in the coming weeks/months? In the last post I argued that it could, but there are of course more bearish ways of looking at it. So far the chart is showing a different channel for the current price (although this could change with a higher high). The channel is pointing downwards; this could signal a reverse in price trend:
If we assume that support will hold here, where would price be heading in the short to mid term? There are two obvious trend lines which we will have to include which are shown here:
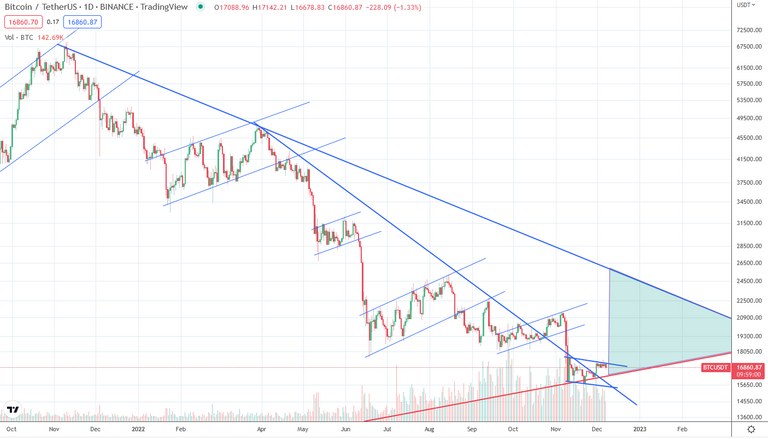
These trend lines come from the previous tops of which the lower one has been broken on two occasions. Currently price is still above this one. The top one would be a target area if price should move up again. This would be about the 21-22k area. We could then expect a rejection and the price to retest the red macro trend line.
As a general reminder: Please keep in mind that none of this is official investment advice! Crypto trading entails a great deal of risk; never spend money that you can't afford to lose!


Check out the Love The Clouds Community if you share the love for clouds!
Thanks buddy! ♥️
A rejection? What does that mean?
not in the social sense 😅 in charting (or perhaps in my language) it means that price will bounce off of a trend line and head back lower
I've been investing since June in bitcoin. If it goes lower still, I'll be investing more. I'm at the point where I'll be happy whichever way it goes. And I gotta say, I mostly follow your advice, after comparing it to others'.
Great post! Still belive we might see a relif, based of funding and weekly bullish divergence, atleast give us a short squizze..
looks good!
Last update, sry no one else to discuss charts with hehe 😊 Will we break the trendline as in 2019 or dump again?
well since TA suggests the bear market should have ended by now, I think a breakout to the top is more likely 👍
Thanks for reply! 😃👍 If so then bottom for alts/usdt should be in also I think, atleast the good ones.
Next stop nobody knows!
That would indeed be a possibility, but it's not very likely
Yeah hope you are right, I just like to scare people.