Crypto Analysis | Bitcoin Update
Good day Hiveians!
Join me in analyzing the crypto markets!
It's already a month since my last Bitcoin update!
Time really seems to fly once again and the markets are doing their thing. Yesterday had a "wolf moon", but as pointed out earlier the Moon-Bitcoin connection is spurious at best. More importantly, are the weekly closes and the trend lines which predict future price action very successfully.
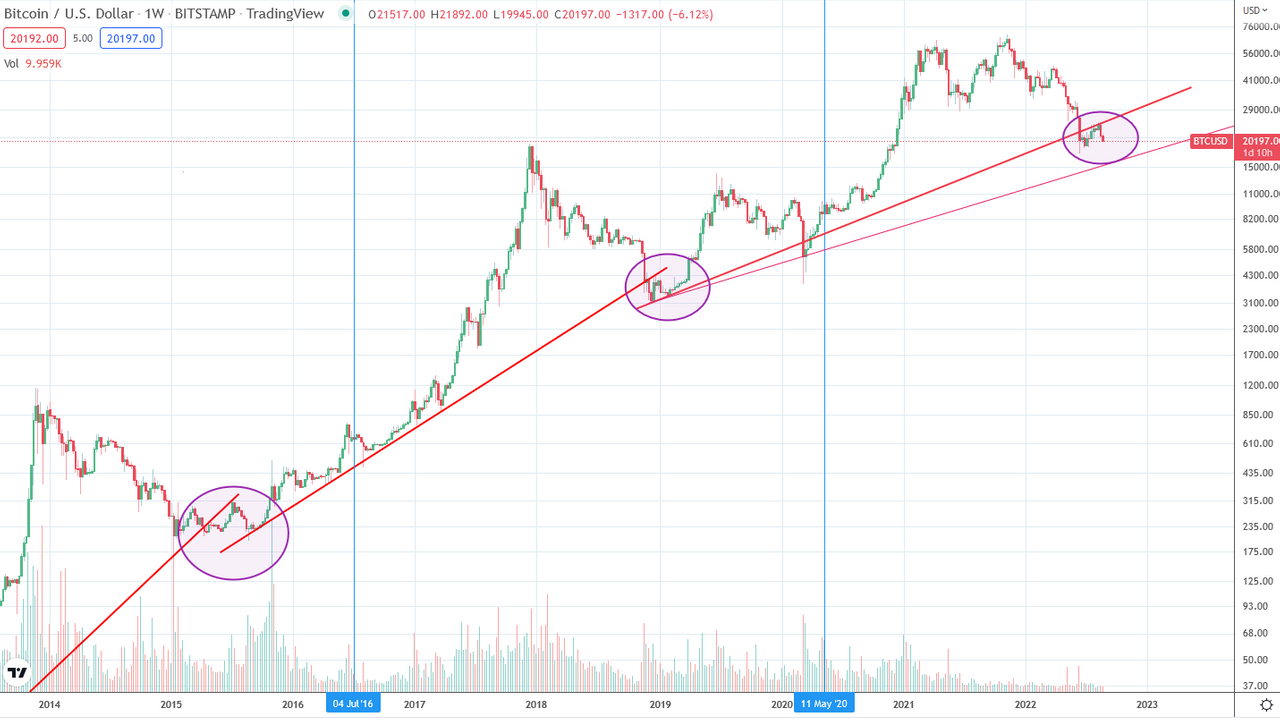
If you have been following my blog, you have seen this chart which I have been posted for a very long time. The gist of it is that it has so far reliably predicted the bottom of a bear market by connecting the weekly lows in a trend line. In the chart below you can see that on the right side there are two trend lines for the current cycle: one for the daily chart (thicker) and one for the weekly chart (thinner). We now know that the lows from the daily chart did not hold.
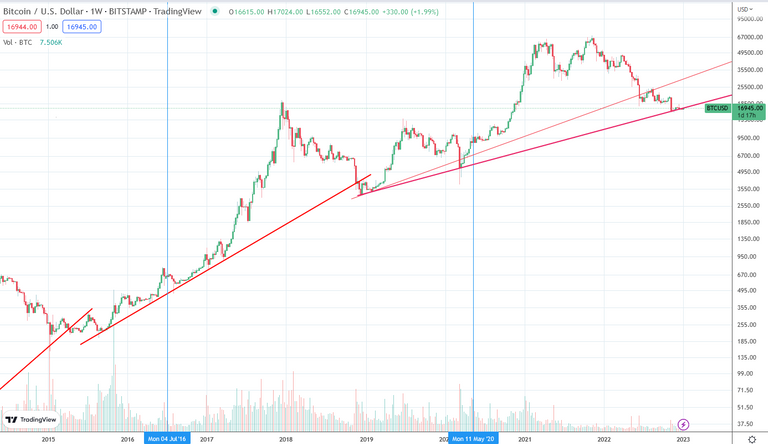
The updated chart looks like this:
It perfectly predicted the current lows. However, there is a caveat if you look closely: Previously price always dipped under the trend line, before it recovered again. If so, we could expect Bitcoin to have one more dip down to about 12k. But I think one could argue that this does not necessarily have to happen this time because the shape of the movement has already repeated as in previous cycles.
In 2018 price crashed past this trend line and then recovered. In 2015 price continued a sideways movement where price did not significantly head lower. The way price moved after it reached those trend lines looks now very similar to what we saw since crossing the thinner trend line in the current cycle. For this reason, I think it is quite possible that price will stay within the current range of 16k or head higher, marking the end of this bear cycle. But even if price does break this support, we can expect it to be not too dramatic. Heading to around 12k is "only" another ~25% correction. If that is what it takes to end this bear, so be it!
When we zoom in we can see this trend line and some resistances:
Again, price has been holding just expected at current levels. But just barely. There is a bigger resistance at current levels - if it breaks it, we can expect price to head to the next higher resistance trend line to around 22k. If not, then expect 12-13k.
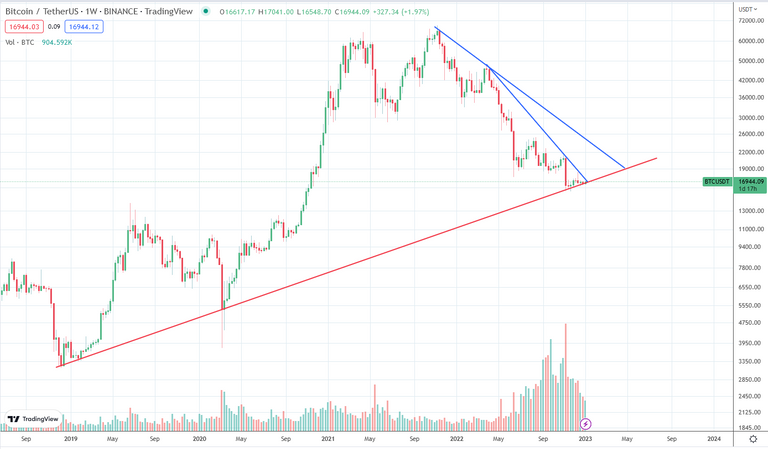
Here are the two scenaios:
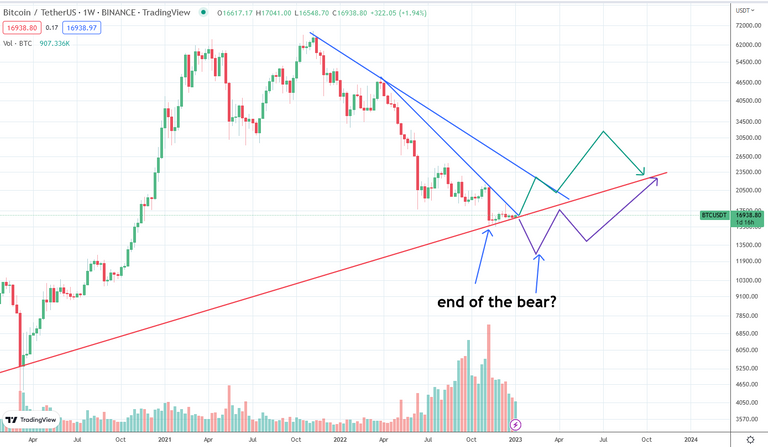
In any case, I would expect the bear market to have ended in November 2022 or in the next months! This means that now should be a good time to get back into Bitcoin and good crypto projects in general if you can hold for 3+ years.
As a general reminder: Please keep in mind that none of this is official investment advice! Crypto trading entails a great deal of risk; never spend money that you can't afford to lose!


Check out the Love The Clouds Community if you share the love for clouds!
https://twitter.com/1460818780980973570/status/1611649037798703106
The rewards earned on this comment will go directly to the people( @hivehotbot ) sharing the post on Twitter as long as they are registered with @poshtoken. Sign up at https://hiveposh.com.
Great work. The next bull is in 3+ years?
I consider the end of the bear already as the start of the bull. But it has different phases starting with a very slow ramp up.
thats good news, I can get some more stacking in
now should be the best time for accumulation :)
$WINE
Congratulations, @theguruasia You Successfully Shared 0.200 WINEX With @tobetada.
You Earned 0.200 WINEX As Curation Reward.
You Utilized 2/4 Successful Calls.
Contact Us : WINEX Token Discord Channel
WINEX Current Market Price : 0.157
Swap Your Hive <=> Swap.Hive With Industry Lowest Fee (0.1%) : Click This Link
Read Latest Updates Or Contact Us
Thanks!
Congratulations, @tobetada Your Post Got 93.9% Boost.
@theguruasia Burnt 4.949 WINEX & We Followed That Lead.
Contact Us : CORE / VAULT Token Discord Channel
Well your work and trading Analysis are really good. I really appreciate your work. Your sharing really informative information. It's really good beginners like us.
Happy to hear!
Really i like your work.
@tipu curate
Upvoted 👌 (Mana: 39/49) Liquid rewards.