Crypto Analysis | A Normal Correction
Good day Hiveians!
Join me in analyzing the crypto markets!
Yesterday Crypto saw a smaller correction
But many are already asking: will the bear continue? If you study how cryptos move over several years, you will see that there is always an up and down movement. The important thing to see is whether either movement is the more dominant one on the higher scale. For example, we might see a downward trend on the daily chart, but overall on the weekly chart price is going up.
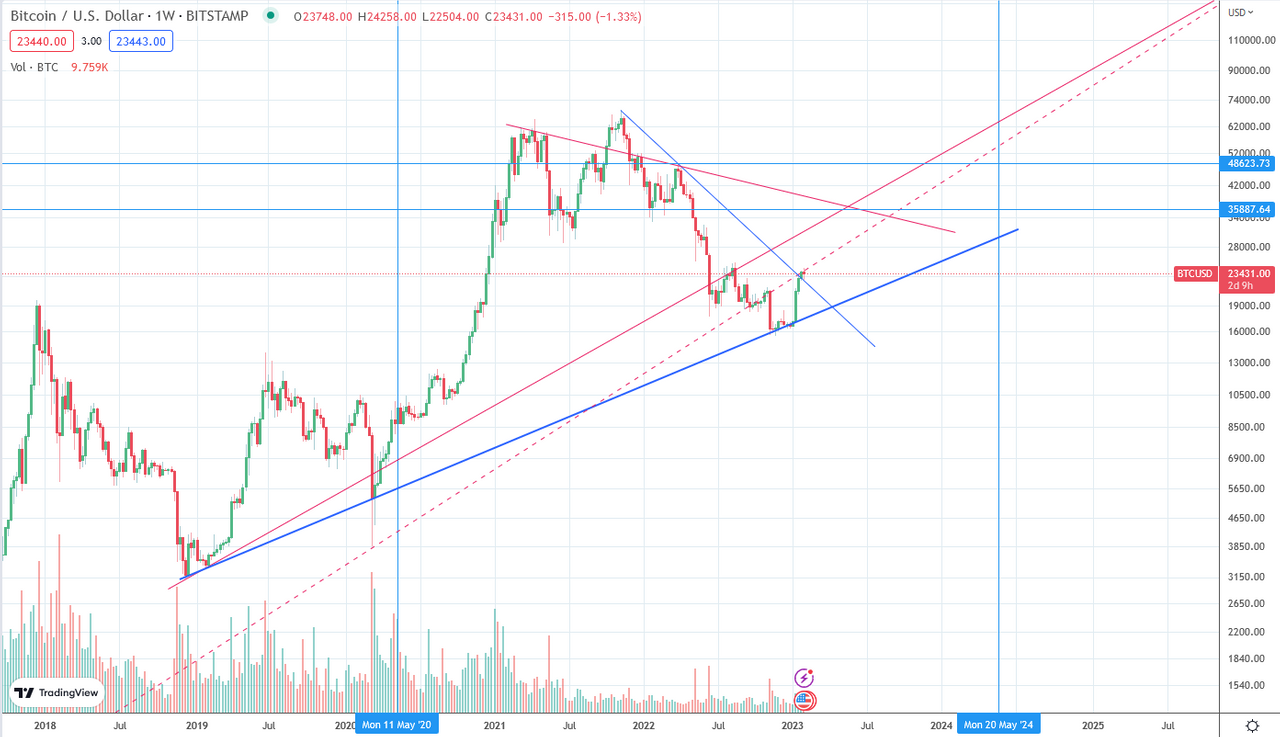
I think the current movement for Bitcoin is similar to 2019: the market was just coming out of a bear cycle, and it was only clear in summer of that year that a much larger movement had taken place. It is easy to not see this until it has transpired. So hindsight is of course always 10/10; but the challenge of TA is to see that before it happens. Here is a chart with the current supports and resistances (blue and orange):
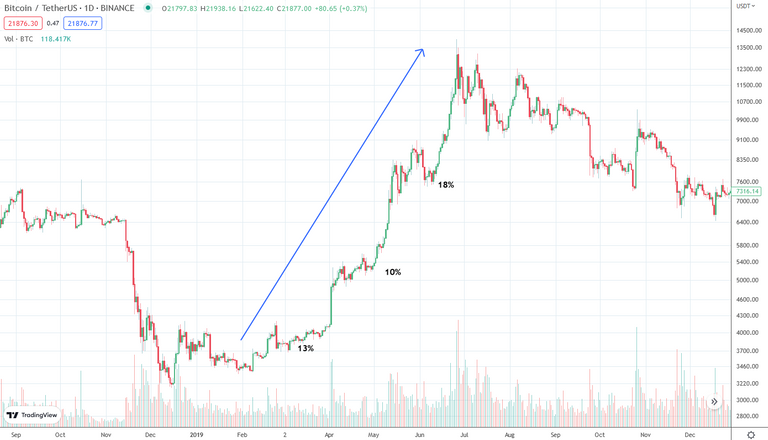
Let's have a closer look at the movement of 2019 which I think is similar to the current one. Yous can see that from January to July price increased from ~$3k to ~$14k, but it was not one continuous line up. There were smaller and mid-sized corrections along the way (seen as the percentages):
My point is this: as long as Bitcoin does not have a larger than ~20% correction, we are on an upwards trend. For this the bottom line of support has to also hold on the weekly chart. If that gets broken, we would also be heading down again.
In the last post I proposed this scenario. An increase until summer of this year to about 38k-48k and a big correction back to about ~23k.
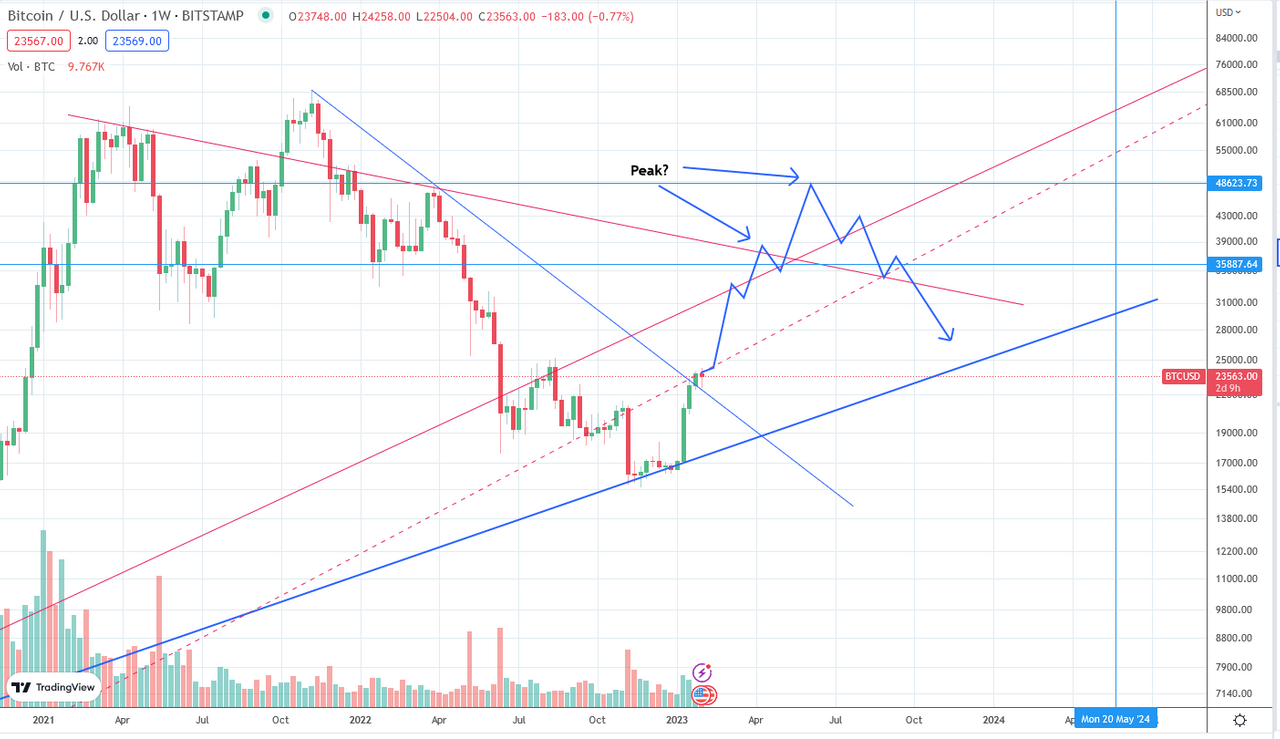
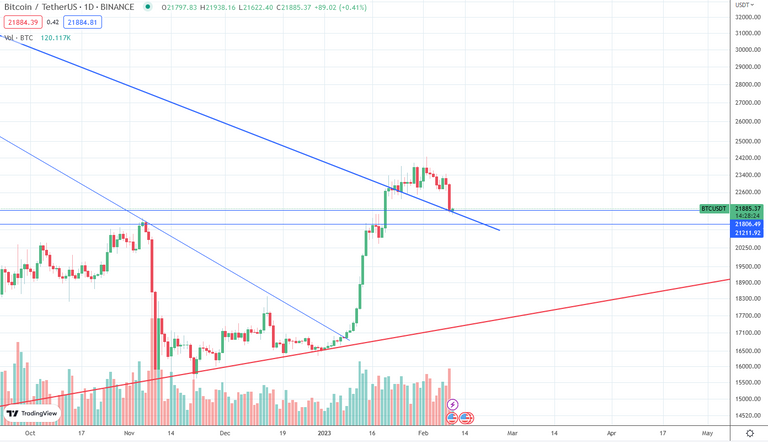
Currently, price held at the former resistance trend line pointing down (now in blue). This should be an important support. There is another horizontal support at about 21k should it fail. But there is not a lot of room if it dips lower than that.
Fingers crossed, that we are on track to higher highs :)
As a general reminder: Please keep in mind that none of this is official investment advice! Crypto trading entails a great deal of risk; never spend money that you can't afford to lose!


Check out the Love The Clouds Community if you share the love for clouds!
The 200-day EMA for Bitcoin is 21,377, and 200-day SMA is 19,724. Bitcoin price bounced from EMA levels for now. It can also test SMA levels. I believe Bitcoin will not break these resistances to the downside. Fingers crossed :)
Posted Using LeoFinance Beta
good points!
Might fill CME gap at 19,5-20k before upside gap at 28k..
I hope not, it is going to be hard getting above this trend line again
@tipu curate
Upvoted 👌 (Mana: 36/46) Liquid rewards.
thank you!
These little dips are necessary to make a momentum to go up. We just need to wait.
👍
I remember the same thing happened in the Monday market of 2019, beta went up and down and then went up again. The people who are saying it will come back to the 15000 point I don't see coming at all and it will be the same people who won't be able to buy bitcoin.