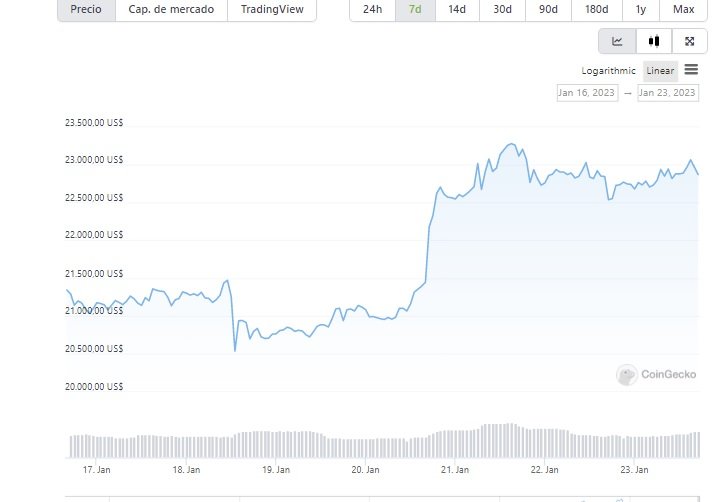
Bitcoin Is it a real rebound? / Bitcoin ¿Es un rebote real? [ENG/ESP]
I took a break from blogging because I was doing a personal study, but I quickly gave up because the study I was doing didn't seem to suit my aptitude, and I'm getting ready to blog again.
Me tomé un descanso de los blogs porque estaba haciendo un estudio personal, pero me di por vencido rápidamente porque el estudio que estaba haciendo no parecía adaptarse a mi aptitud, y me estoy preparando para bloguear nuevamente
We will publish an analysis of the virtual currency at this time.
publicaremos un análisis de la moneda virtual en este momento
From today, I will be posting blog posts from time to time, so please keep an eye out.
A partir de hoy, publicaré entradas en el blog de vez en cuando, así que estad atentos.
Bitcoin weekly chart.
Gráfico semanal de Bitcoin.
The price, which has been falling and converging in the previous descending wedge pattern for at least a year.
This is because it is a candle with a high probability of a strong trend reversal. I did not expect such a strong rise, but one candle closed at 21%. And the next candle also had a long bullish close at 8.8%, and the next candle, this week's candle, is yet to be seen, but it is forming a bullish candle.
El precio, que ha estado cayendo y convergiendo en el patrón de cuña descendente anterior durante al menos un año
Esto se debe a que es una vela con una alta probabilidad de un fuerte cambio de tendencia. No esperaba un aumento tan fuerte, pero una vela cerró con un 21%. Y la próxima vela también tuvo un cierre alcista largo en 8.8%, y la próxima vela, la vela de esta semana, aún está por verse, pero está formando una vela alcista.
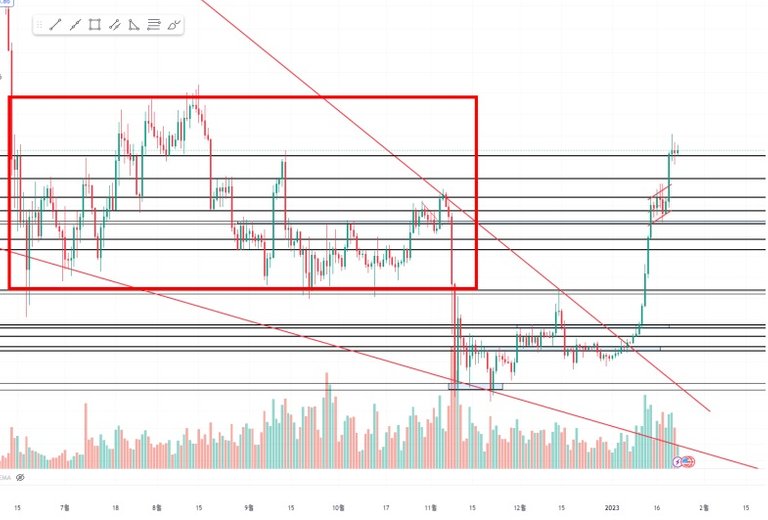
Bitcoin daily chart.
Gráfico diario de Bitcoin.
In the process of falling for a long time, many listings were formed. There was a lot of trading in the area marked with a red square. In addition to individual investors trading short term or buying forces, there will surely be many groups who think this section is the bottom and buy with the purpose of investing for the long term. Eventually, however, further falls broke the previous low and, to put it mildly, it is over. That is, a loss has occurred. Then, most of them will have a break-even mentality that they will want to find even rather than make a profit. Then, when the downward market price rebounds and rises to the corresponding section, a selling group appears and acts as resistance.
En el proceso de caída durante mucho tiempo, se formaron muchos listados. Había mucho comercio en el área marcada con un cuadrado rojo. Además de los inversores individuales que comercian a corto plazo o las fuerzas que compran, seguramente habrá muchos grupos que piensan que esta sección es la parte inferior y compran con el propósito de invertir a largo plazo. Eventualmente, sin embargo, más caídas rompieron el mínimo anterior y, por decirlo suavemente, se acabó. Es decir, se ha producido una pérdida. Entonces, la mayoría de ellos tendrán una mentalidad de punto de equilibrio que querrán encontrar incluso un punto de equilibrio en lugar de obtener una ganancia. Entonces, cuando el precio de mercado a la baja rebota y sube a la sección correspondiente, aparece un grupo de venta que actúa como resistencia.
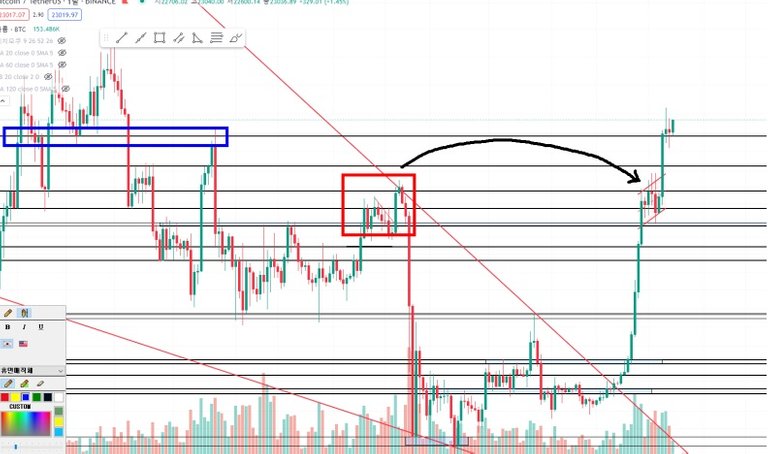
There was no strong resistance in the middle, but there was a section where the speed decreased. And after the digestion (break of resistance) ended, it led to a higher edge. Now, you have to digest the previous peak and the sales chart above it, indicated by the blue square, to open higher. If resistance here is strong, we should leave open the possibility of a correction until a new uptrend occurs. If so, it could be a buying opportunity for those who had cash.
No hubo una fuerte resistencia en el medio, pero hubo una sección donde disminuyó la velocidad. Y después de que terminó la digestión (ruptura de resistencia), condujo a una mayor ventaja. Ahora, tienes que digerir el pico anterior y la tabla de ventas encima de él, indicada por el cuadrado azul, para abrir más alto. Si la resistencia aquí es fuerte, deberíamos dejar abierta la posibilidad de una corrección hasta que se produzca una nueva tendencia alcista. Si es así, podría ser una oportunidad de compra para aquellos que tenían dinero en efectivo.

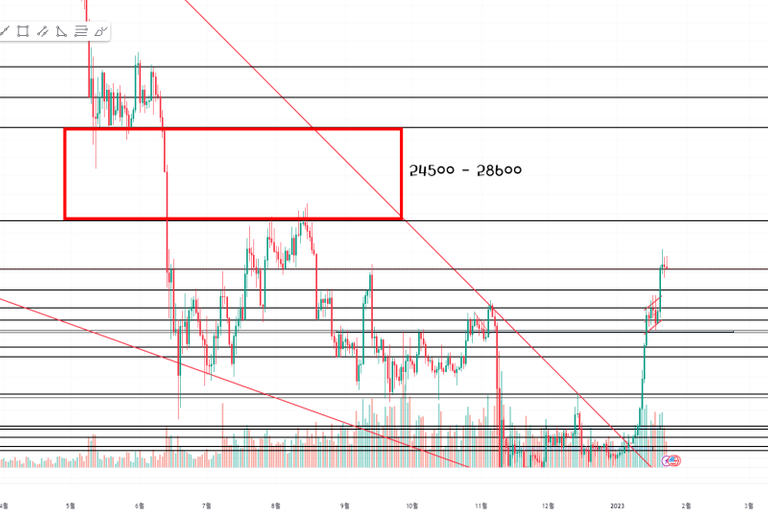
If it only goes up to $24,500, it will be much easier to go from $24,500 to $28,600 because there are so few listings. This means that even with a much lower purchase price, it will be able to rise as much as before. The profit selling volume from the groups that bought below the level may act as resistance. However, I think it will be much weaker than the previous price resistance.
Si solo sube a $ 24500, será mucho más fácil subir de $ 24,500 a $ 28,600 porque hay muy pocos listados. Esto significa que incluso con un precio de compra mucho más bajo, podrá subir tanto como antes. El volumen de venta de beneficios de los grupos que compraron por debajo del nivel puede actuar como resistencia. Sin embargo, creo que será mucho más débil que la resistencia de cotización anterior.

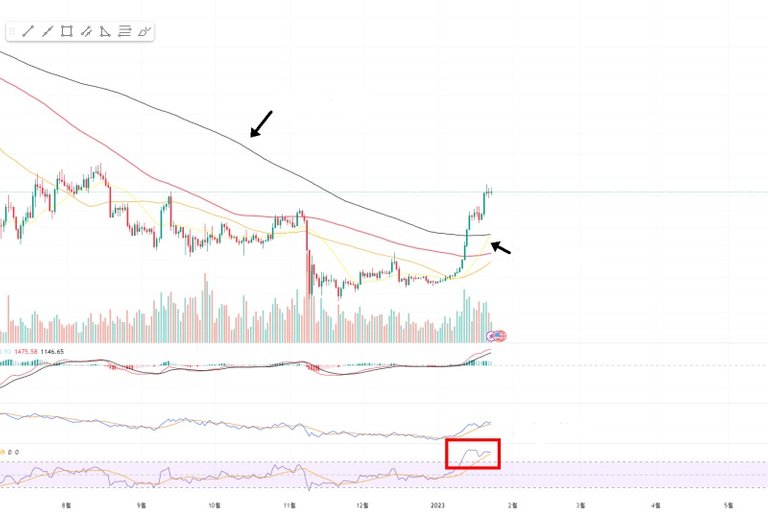
The 200-day moving average (long-term moving average), which had been falling sharply, turned softer and the price broke through to the upside. Soon, the 20-day moving average (short-term moving average) is also set to cross this golden cross. It can be seen as a sign that the short term trend is very strong.
El promedio móvil de 200 días (promedio móvil a largo plazo), que había estado cayendo abruptamente, se volvió más suave y el precio se abrió paso hacia arriba. Pronto, el promedio móvil de 20 días (promedio móvil a corto plazo) también está listo para cruzar esta cruz dorada. Puede verse como una señal de que la tendencia a corto plazo es muy fuerte.

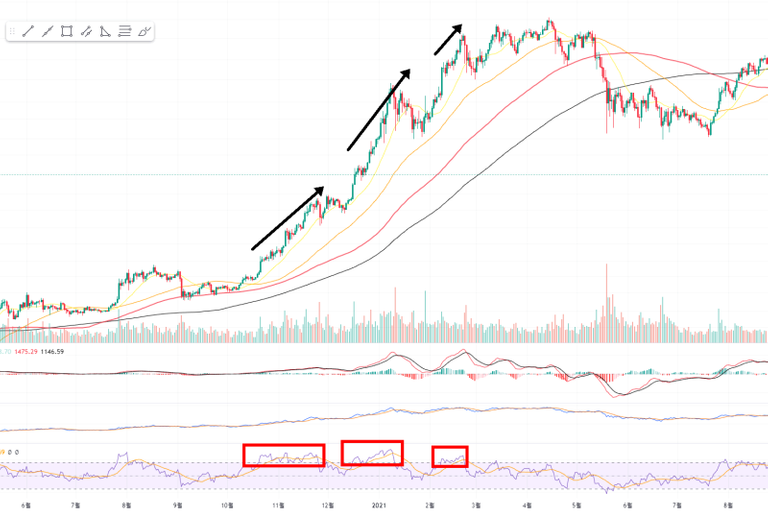
The overbought signal continued to appear even as the previous Bitcoin price rose from $10,000 to $60,000.
La señal de sobrecompra siguió apareciendo incluso cuando el precio anterior de Bitcoin aumentó de $10 000 a $60 000.

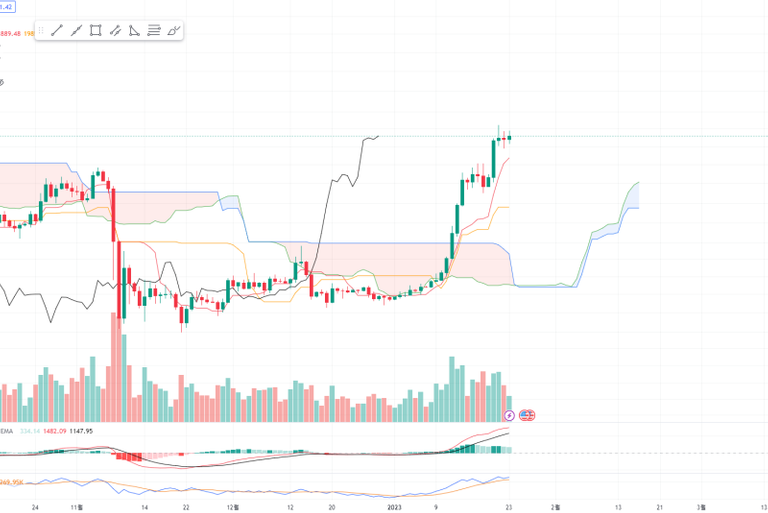
The overbought signal continued to appear even as the previous Bitcoin price rose from $10,000 to $60,000.
todas las señales que puede ver apuntan a una tendencia alcista. La línea de conversión se rompe por encima de la línea de base, el tramo rezagado se rompe por encima del precio de hace 26 días, el precio ingresa a la zona de nubes y luego se rompe por encima, el tramo principal 1 se rompe por encima del tramo principal 2, etc.

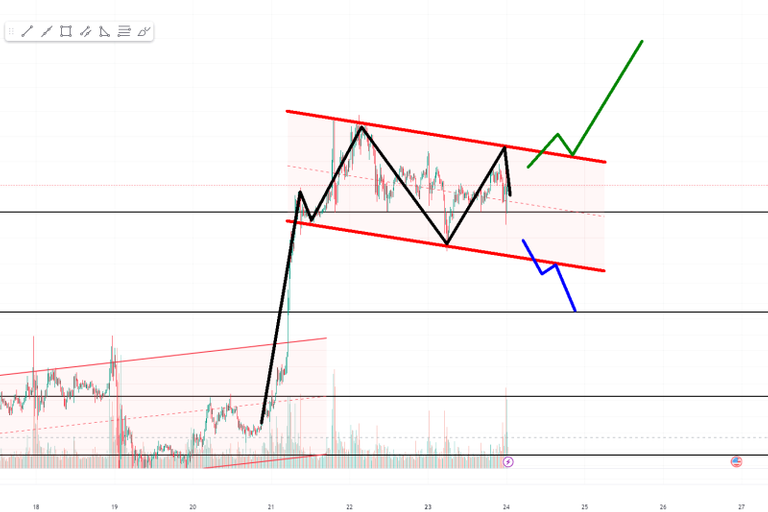
Finally, let's look at Bitcoin's short-term 15-minute trend.
Finalmente, veamos la tendencia a corto plazo de 15 minutos de Bitcoin.
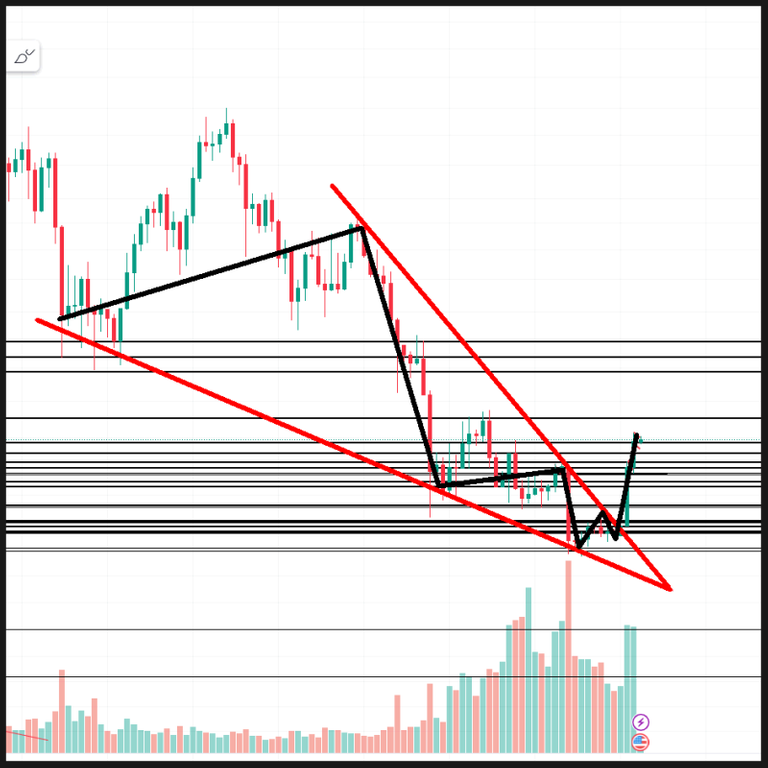
It is a process where the market price explodes and undergoes correction. As many of you will know, it goes with a movement similar to the bull flag pattern.
Es un proceso en el que el precio de mercado explota y sufre corrección. Como muchos de ustedes sabrán, va con un movimiento similar al patrón de la bandera alcista.
You are responsible for your trade.
Usted es responsable de su comercio.

