Bitcoin Emergency!!! Bullish Divergence Signals Flashed On BTC Charts
Hi friends hope you're welcome to the new update on Bitcoin
Moving in channel and lost the support:
On a weekly time frame, since July 2022 Bitcoin is still moving inside a down channel and while moving downside in this channel the leading cryptocurrency has broken down a very significant support of $17500 and now the next major support is at $15500.
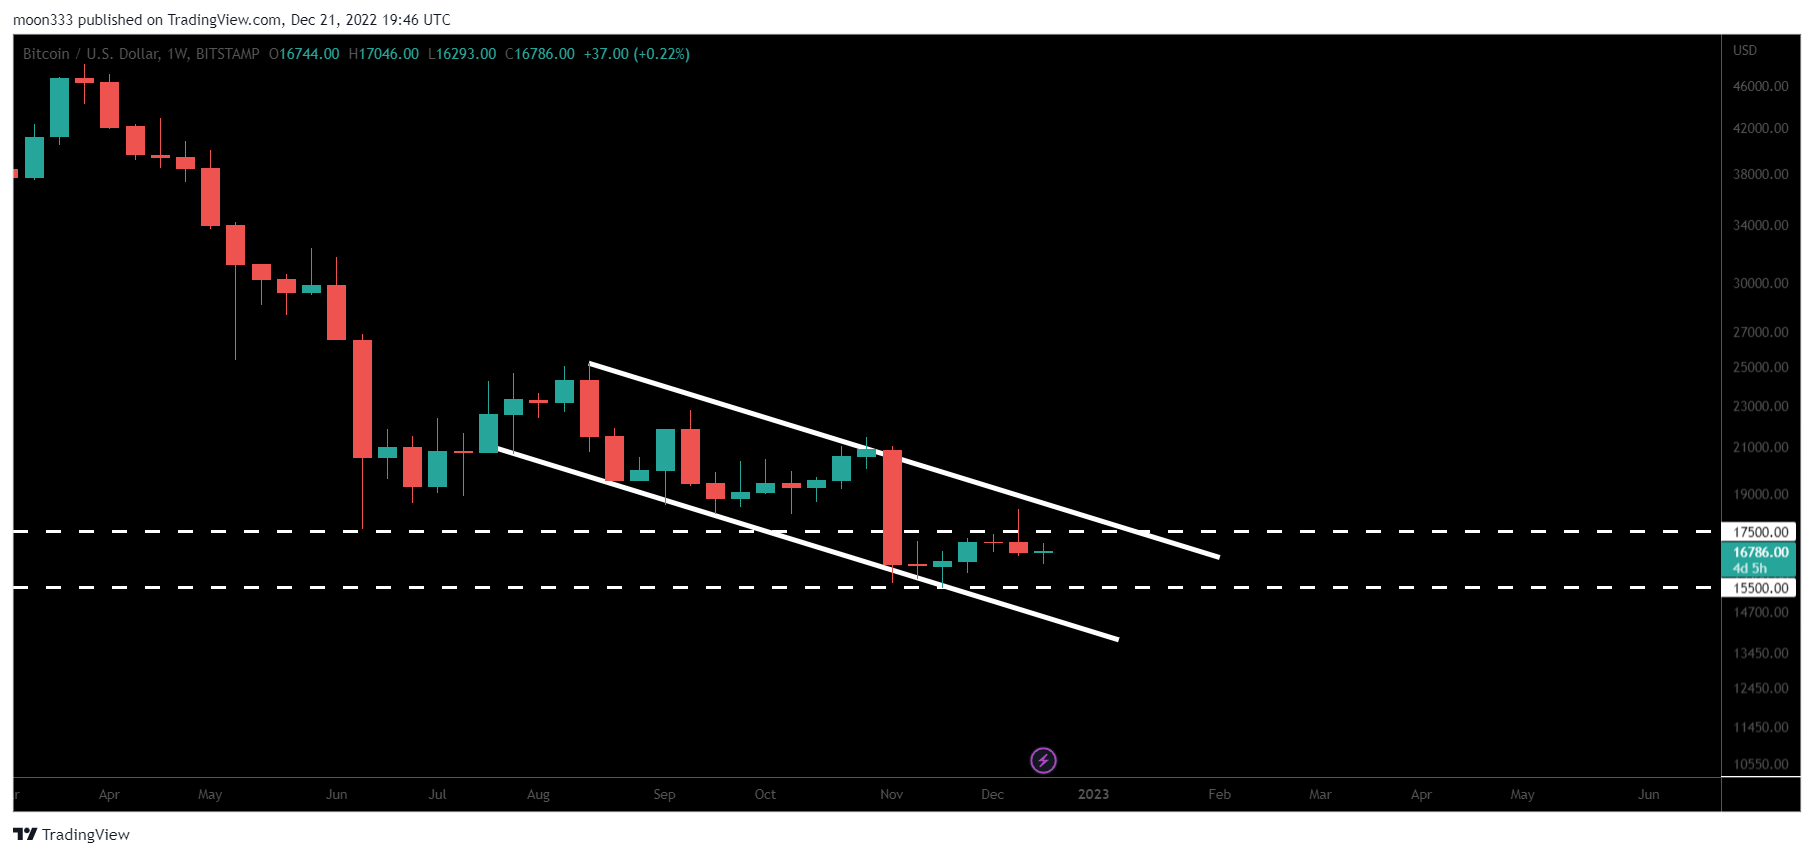
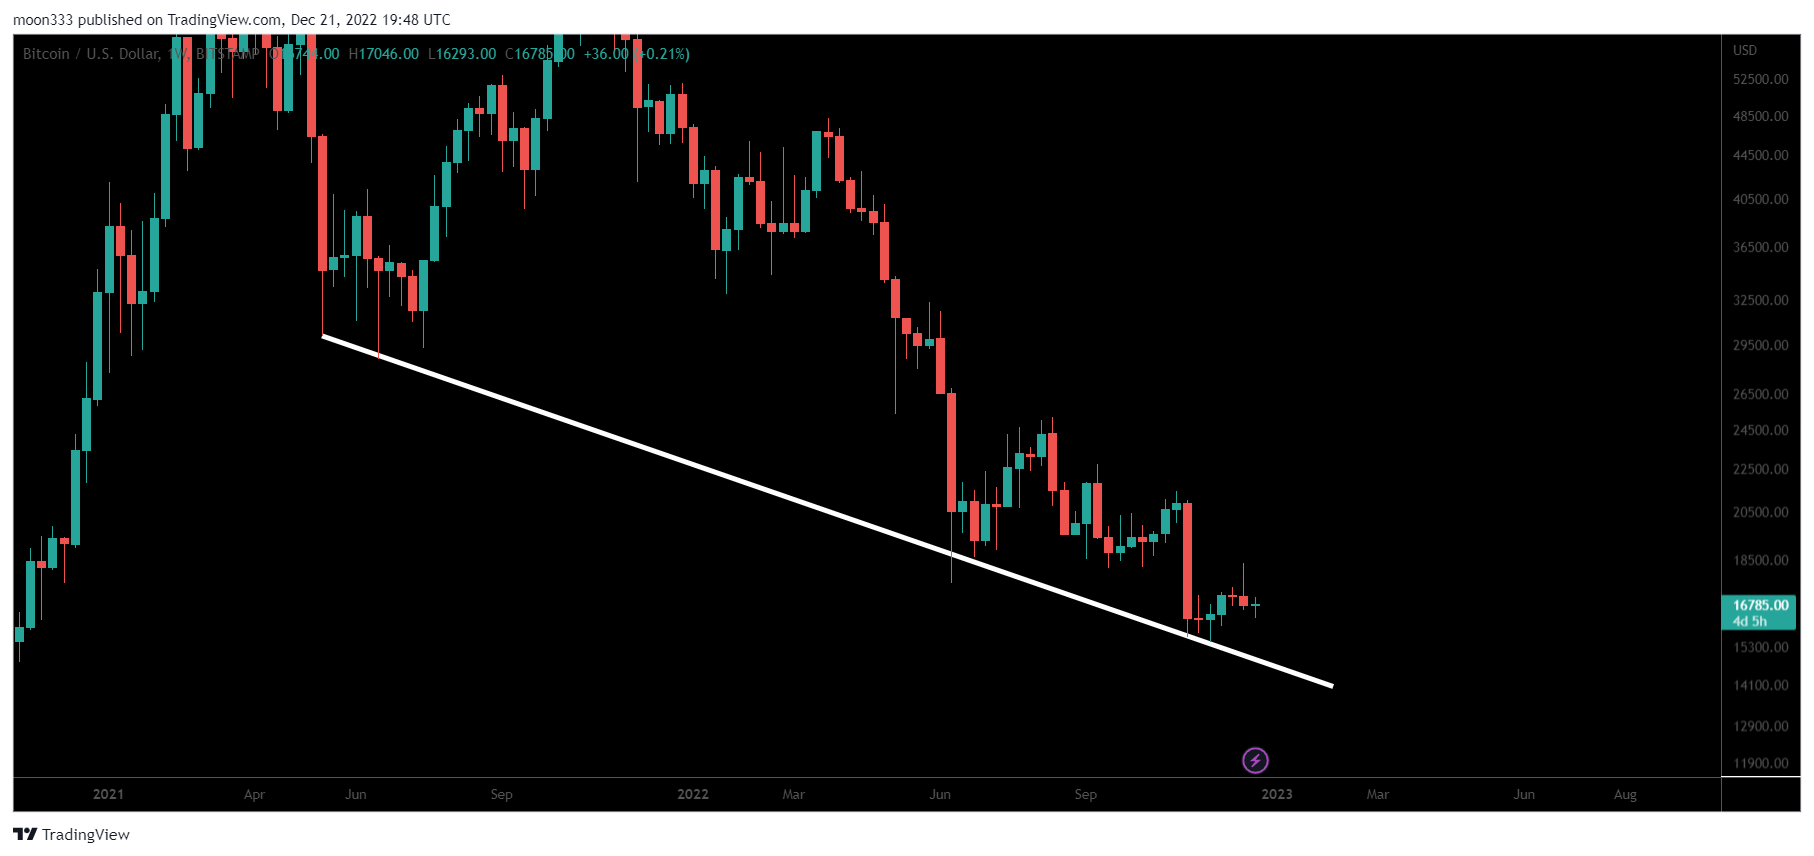
Long term support:
Bitcoin recently has also bounced from another long-term down trendline support. This support was found in the month of May 2021 and so far BTC did not break down this support.
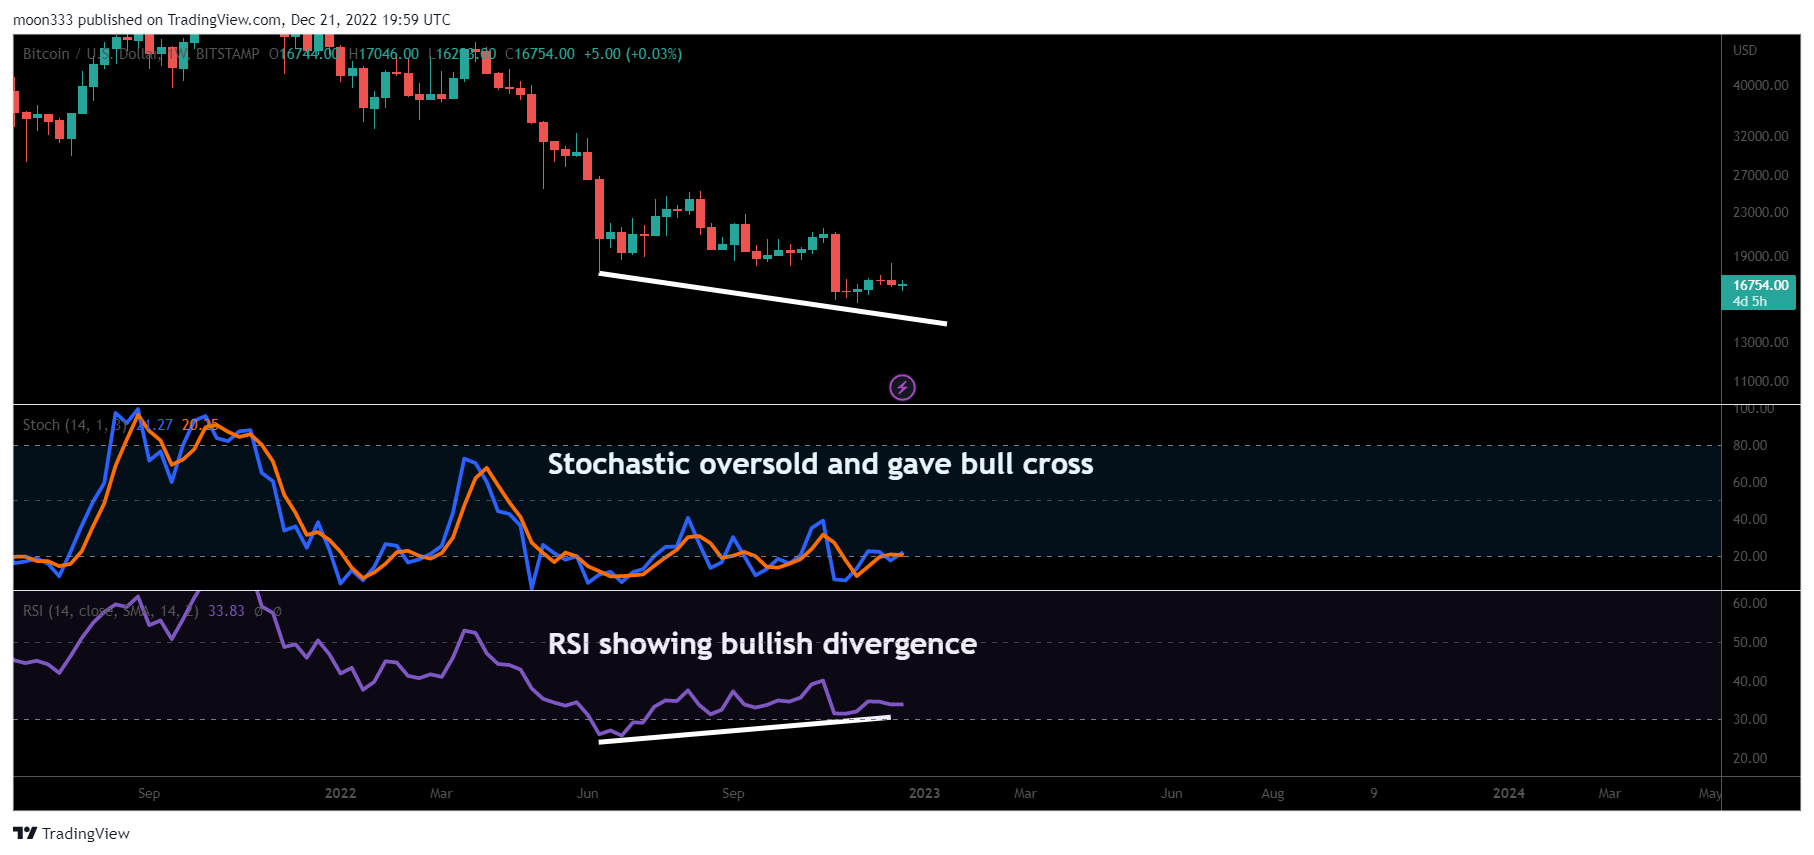
Bullish divergence:
On a weekly time frame, Stochastic oscillator was completely oversold and recently we have received the bull cross by stochastic oscillator that is a bullish signal at the same time it can be also observed that the price line of BTC is forming lower low on the other hand RSI oscillator is forming higer low that is a bullish divergence signal and on the weekly time frame such bullish divergence has a very high significance.
Harmonic move:
On 15th of December I shared a post in which I told that Bitcoin has completed all the dimensions of a harmonic bullish reversal Shark pattern, therefore, for the completion of the final leg of the pattern we can expect a drop, and the price dropped and completed the final leg of the bullish Shark pattern and now there is a very high probability that the priceline may start the next reversal move from the potential reversal zone of this pattern.
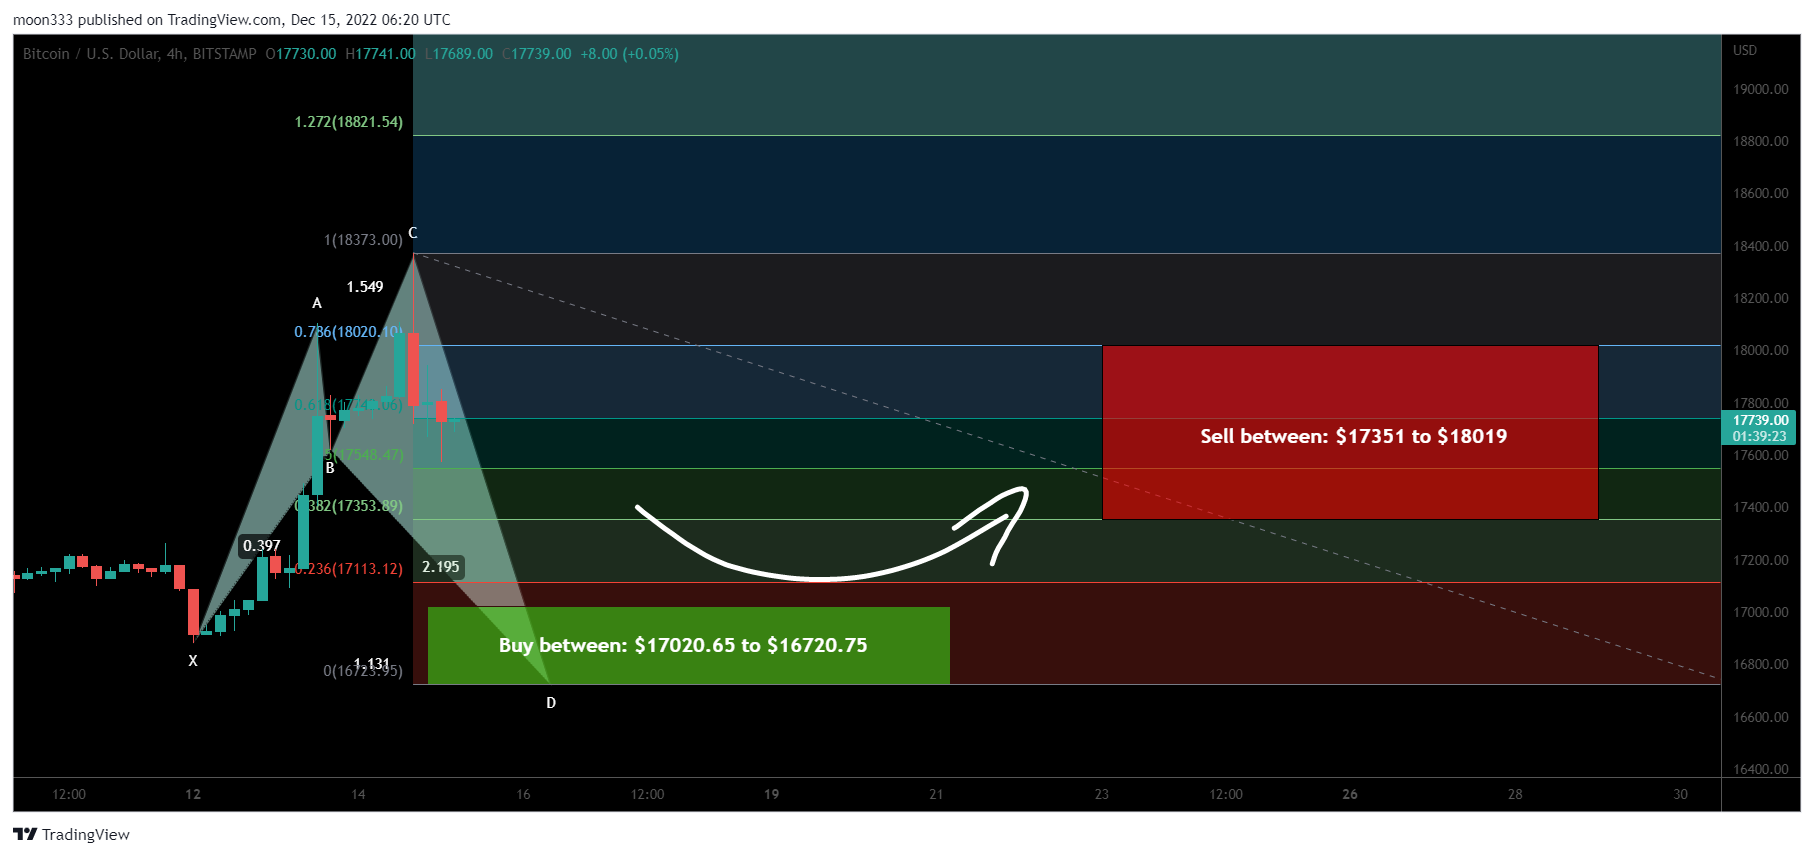
https://www.patreon.com/posts/75941761
Conclusion:
Bitcoin has already formed two bullish biased patterns. One is harmonic bullish reversal Shark pattern on a 4-hr time frame, and the second one is the down channel on the weekly time frame, at the same time the appearance of the bullish divergence on the weekly time frame can have a very high significance and it can be a big indication for a big breakout soon.