Positive Divergences on Bitcoin Price Chart
There are a few positive divergences on Bitcoin Price chart. These signals started new on the chart. These are the signals of the bottom. Bearish season may be ended until end of January.
The new year may begin bullish for crypto and all stock markets. So, we may see mini rally on crypto market..
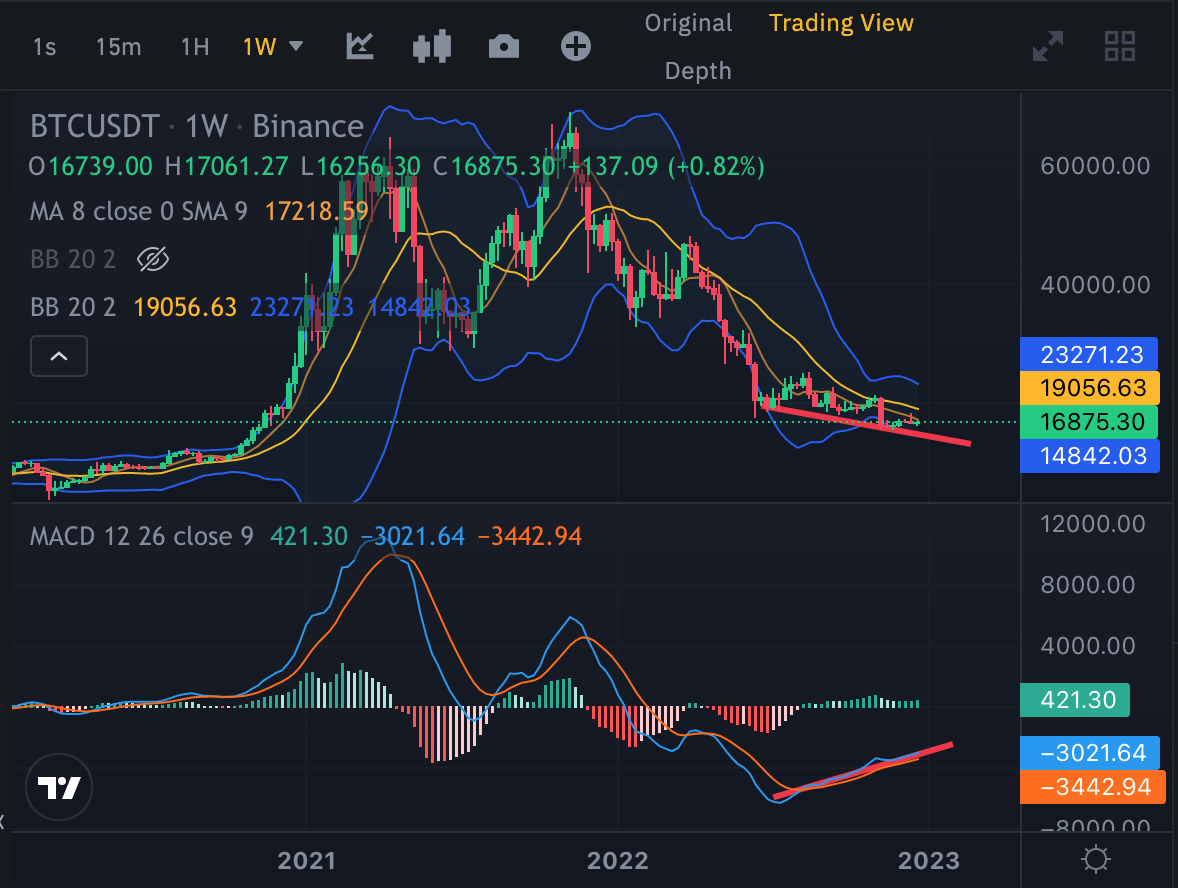
Here you can see weekly chart of Bitcoin. Price is going down until Luna Crash but MACD Indicator is going up. It is positive divergence that say us price may be go up!
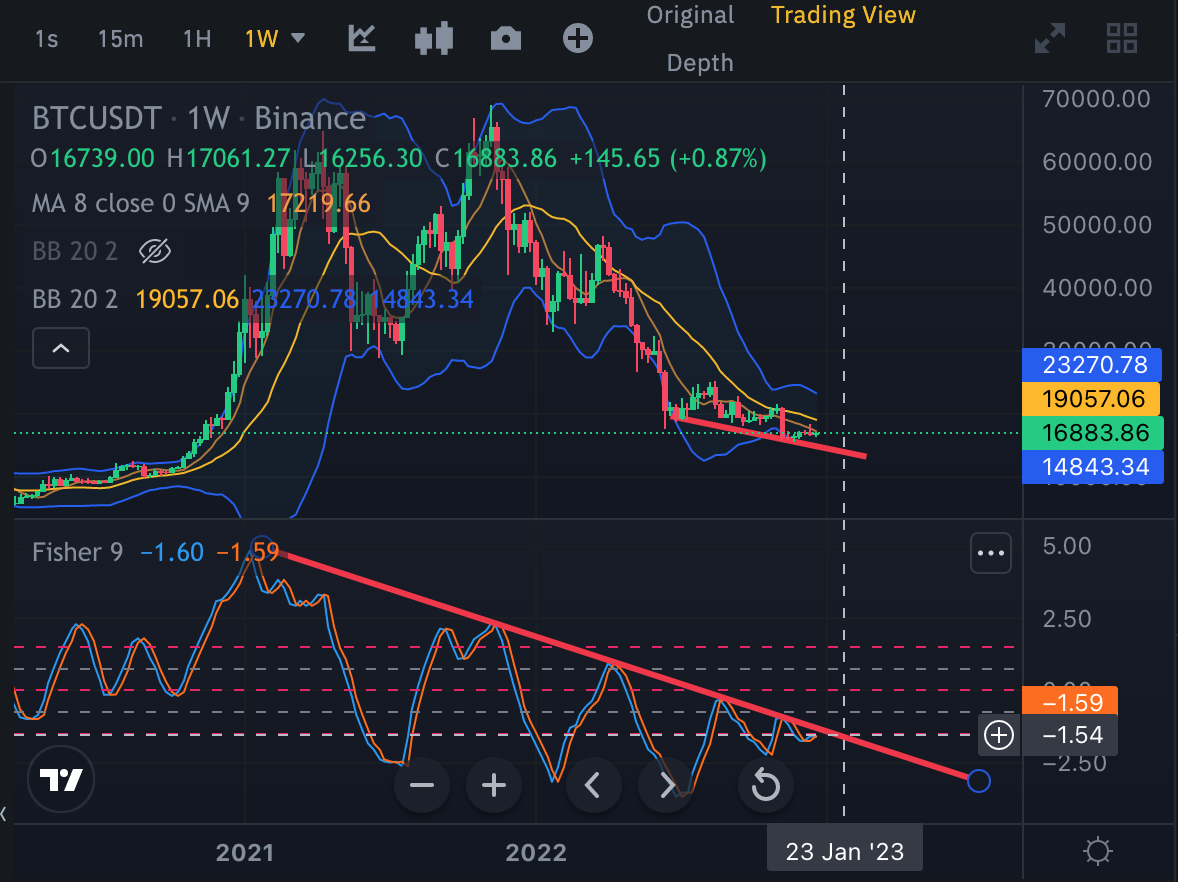
Here you can see alo Fisher Indicator on weekly chart. There is great resistance on Fisher Indicator that will be broken up in a few weeks. That is why January may be good for crypto market. We may see this resistance broken up until end of January.. So we may say that bearish season is ended...
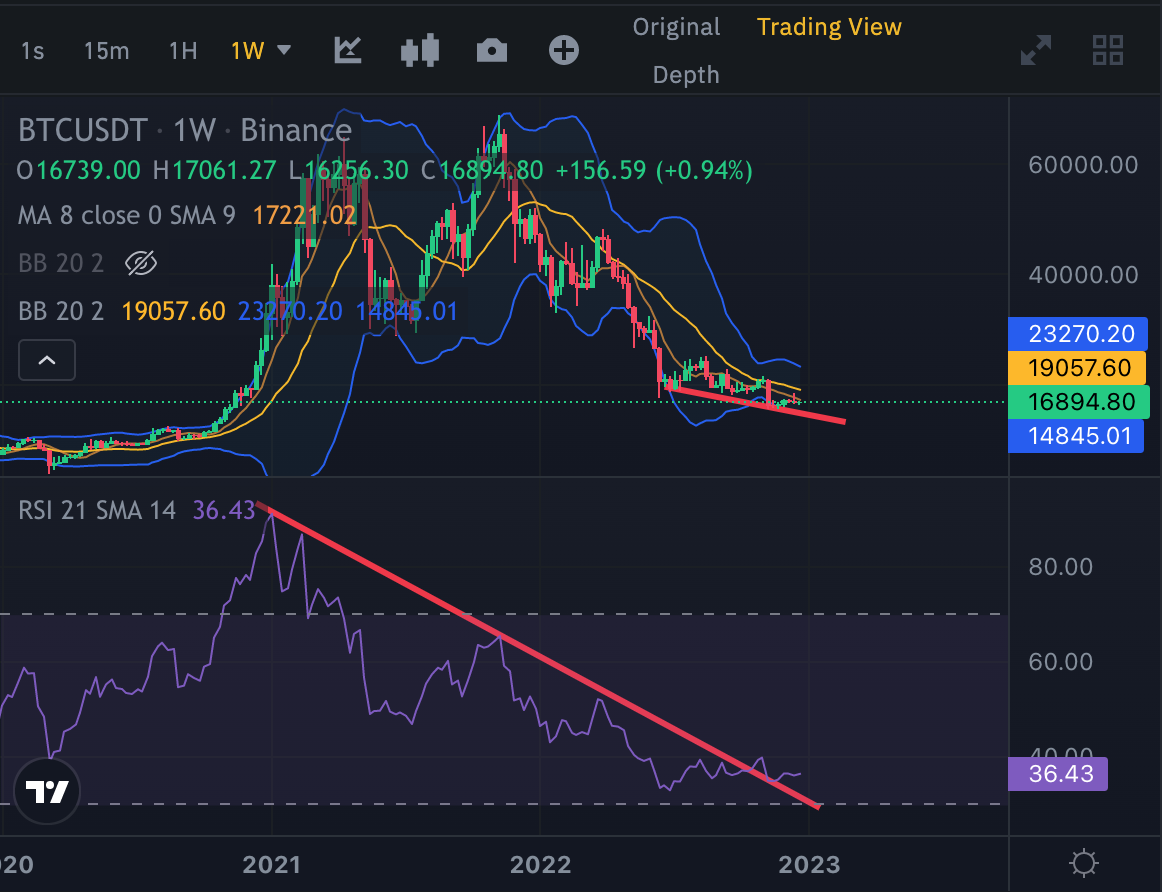
Here you can see also RSI Indicator on weekly chart. It is broken up and retested. So, future of Bitcoin price is bright. We should see breaking pn Fisher Indicator. We need only a few weeks..
2023 may begin good for Bitcoin and crypto market. We may see small bullish rallies. The worst is not happened. ıt may be happened in 2023 but we may begin to pick up crypto slowly in these levels..
Because there are positive divergences on Bitcoin Price chart. I share a post about Hive price chart and there were also a few positive divergences. So, Positive divergences began to be seemed on charts..
We will see..
Posted Using LeoFinance Beta
it seems like there will be one last fall but I hope it rises now
Let's hope we start the year in good shape, we know we are not in the best moment but we are going little by little with expectations.