Bitcoin Price Will Touch 100-Day Moving Average
Bitcoin price may touch 100-day average which worked as resistance before.. It is on 17900 USD level that may be resistance for Bitcoin price.
So, you should be very careful and see price action until hitting 100-day moving average. We may see huge moves on chart.
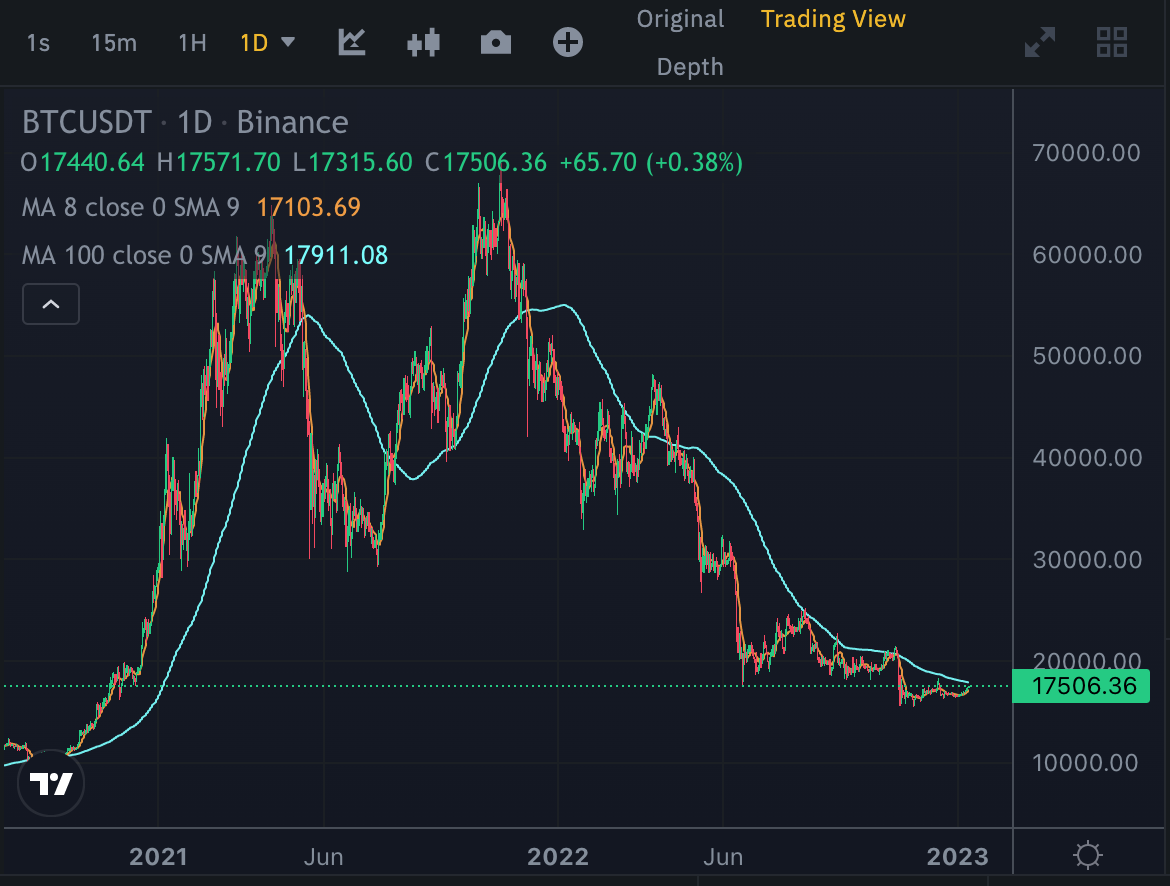
100-day moving average worked as resistance in 2022. If Bitcoin price breaks up this resistance and stays above, we can say that bearish season ended..
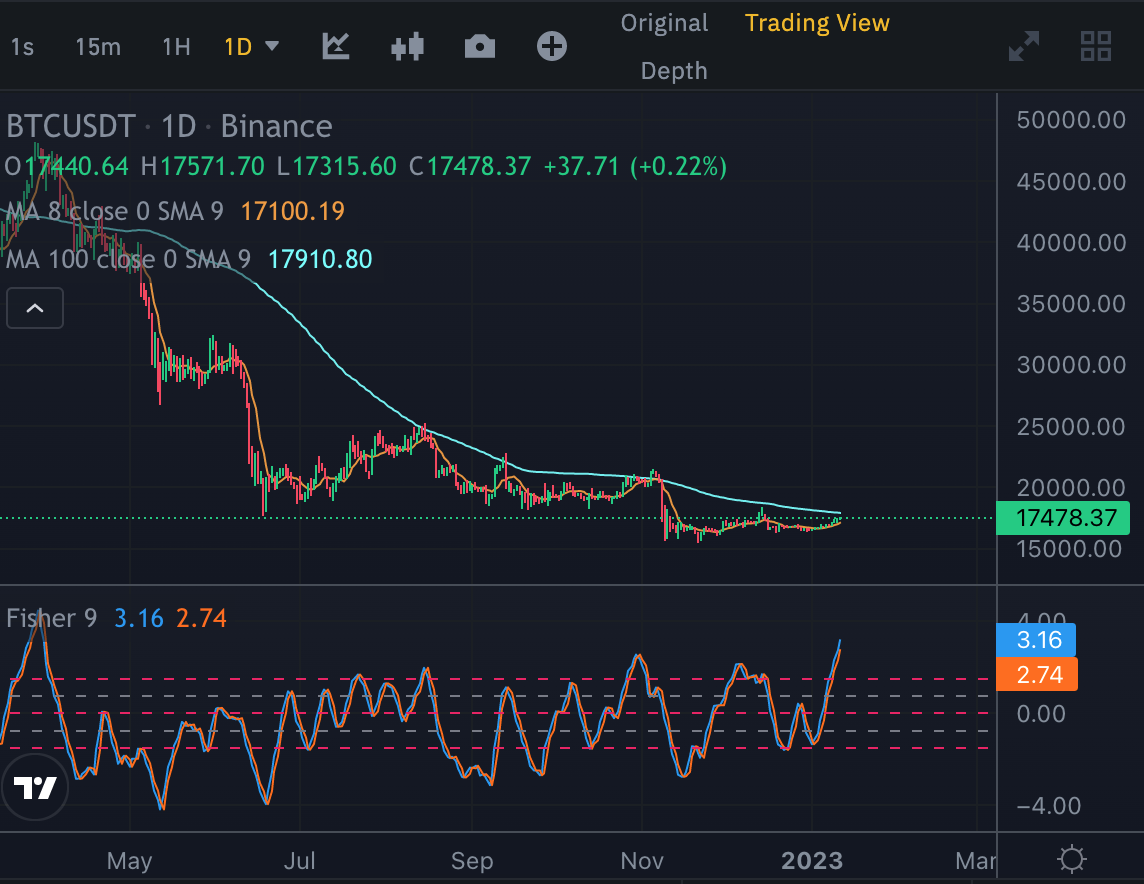
Here you can see daily chart of Bitcoin and Fisher Indicator. Fisher Indicator is on the top and will reverse in a few days. So, after hitting 100-day moving average we may see price correction.
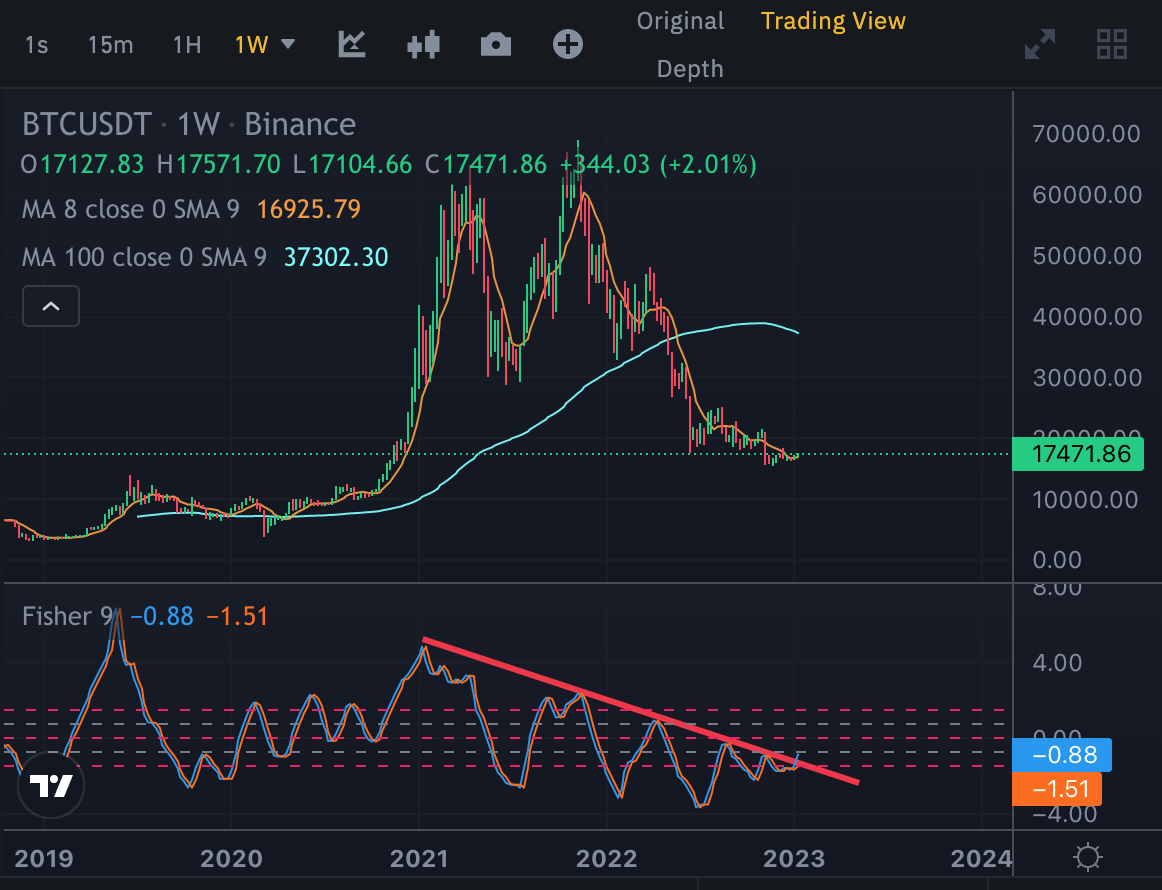
Here you can see weekly chart of Bitcoin and downtrend may be ended. There is downtrend of Fisher Indicator and it may be broken up this week.
So, dont be scared by FUDs. Time to pick up...
Posted Using LeoFinance Beta
I don't understand, are we going up or down?
100-day is important. I am only sure that we will hit 100-day. After hitting, I dont know. but I believe that 60% up 40%down, after hittin 100-day MA.
how long should it take before we get there?
https://twitter.com/3018665008/status/1613252042960560128
The rewards earned on this comment will go directly to the people( @acesontop ) sharing the post on Twitter as long as they are registered with @poshtoken. Sign up at https://hiveposh.com.