News and new 12H PG in Bitcoin
The labor market data and the perfect setup
The markets have once again waited for the labor market data in the U.S. and have been somewhat on the move as a result. Even though it is only very low-paying jobs, the expected number was even exceeded.
The Dow Jones was somewhat volatile and started right once on the top side through. Now it will be interesting to see if we can hold the level and if the champagne corks pop again at the end of the week.
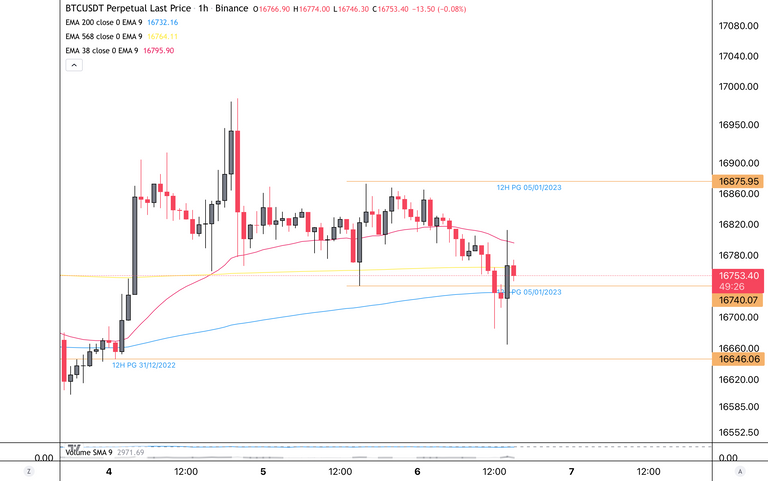
The Bitcoin has also been somewhat infected by the euphoria and is then trotted with a beautiful hourly candle upwards. Here is exactly the same question, do we hold the level so it will be nice and sunny or do we collapse and it starts raining?
12H PG Agglomeration
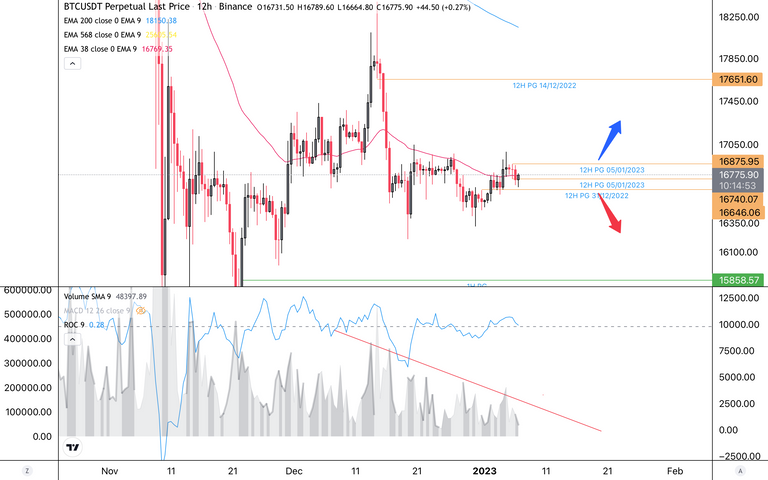
The 12 hour chart is in focus right now as new signals are forming here one after another. The breakouts are a long time coming but what can you do. If we get a close above the $16,875 level within the next few days, then the party can get started.
Perhaps today the foundation stone for a rally was set with the news, at least that is to be wished. The volume has been decreasing in the Bitcoin chart for several days, so a volatile movement is to be expected. A positive aspect is probably the fact that we see positive divergences in several indicators and a recovery is overdue. Let's wait and see how the day goes today and until then it is called to keep your feet still.
Translated with www.DeepL.com/Translator (free version)
Die Arbeitsmarktdaten und das perfekte Setup
Die Märkte haben mal wieder auf die Arbeitsmarktdaten in den USA gewartet und sind daraufhin etwas in Bewegung geraten. Auch wenn es nur sehr niedrig bezahlte Jobs sind, wurde die erwartete Zahl sogar übertroffen.
Der Dow Jones war etwas volatil und startete gleich einmal auf der Oberseite durch. Jetzt ist es interessant, ob wir das Level halten können und ob am Ende der Woche noch mal die Sektkorken knallen.
Der Bitcoin hat sich auch etwas von der Euphorie anstecken lassen und ist daraufhin mit einer schönen Stunden Kerze nach oben getrabt. Hier ist genau die gleiche Frage, halten wir das Level so wird es schön und sonnig oder brechen wir zusammen und es fängt an zu regnen?
12H PG Ballungszentrum
Der 12 Stunden Chart ist im Fokus momentan, denn hier bilden sich nacheinander neue Signale. Die Ausbrüche lassen zwar auf sich warten aber was soll man machen. Bekommen wir innerhalb der nächsten Tage einen Schlusskurs über der 16.875 $ Marke, dann kann die Party losgehen.
Vielleicht wurde heute der Grundstein für eine Rallye gesetzt mit den News, zu mindestens ist das zu wünschen. Das Volumen ist seit mehreren Tagen abnehmend im Bitcoin Chart, eine volatile Bewegung ist also zu erwarten. Ein positiver Aspekt ist wohl der Fakt, dass wir in mehreren Indikatoren positive Divergenzen sehen und eine Erholung überfällig ist. Warten wir mal ab wie der Tag heute so verläuft und bis dahin heißt es die Füße still halten.
Source/Quelle Charts: Tradingview / Binance / Stock3 - Guidants
Risikohinweis:
Dieser Post stellt keine Anlageberatung oder sonstige Empfehlung dar.
Die dargestellten Analysen, Techniken und Methoden dienen ausschließlich Informationszwecken
und stellen weder eine individuelle Anlageempfehlung noch ein Angebot zum Kauf oder Verkauf
von Finanzinstrumenten dar, sondern spiegeln lediglich die Meinung des Referenten wider.
Eine Haftung ist ausgeschlossen.
Legal Disclaimer:
I am not a financial advisor
nor is any content in this article presented
as financial advice. Never invest more
than what you can afford to lose.
This post is my personal opinion,
do your own research before making any investment decisions.
If you make any trades after reading this post,
it is completely in your responsibility.
Posted Using LeoFinance Beta